Navigation
Tutorial
Overview
One of the great challenges in drug discovery is rationalizing lead optimization. In this phase, compounds that have been identified as the potential drug candidates need to be modified carefully with appropriate absorption, distribution, metabolism, excretion, and toxicity (ADMET) properties. The key questions faced by medicinal chemists are which compound(s) should be made next and how to balance multiple properties. To avoid the poor or ill-advised decisions, it is crucial to draw credible transformation rules from multiple experimental assays and apply them for efficient optimization. Therefore, OptADMET, the first integrated chemical transformation rule platform covering 32 important ADMET properties, is able to provide multiple-property rules and apply invaluable experience for lead optimization. For multiple-property rule database, a total of 177,191 experimental data are used for analysis, which have produced 41,779 credible transformation rules. Besides, 239,194 accurate predicted molecular data are integrated with the initial data for expanded structural conversion exploration, which have converted 146,450 rules as the supplement. Based on the large and credible rule database, OptADMET is able to find desirable substructure transformation and guide the efficient multi-parameter optimization for the queried molecule. Additionally, to benefit the final decision, the ADMET profile of all optimized molecules will also be provided by OptADMET for comprehensive evaluation.
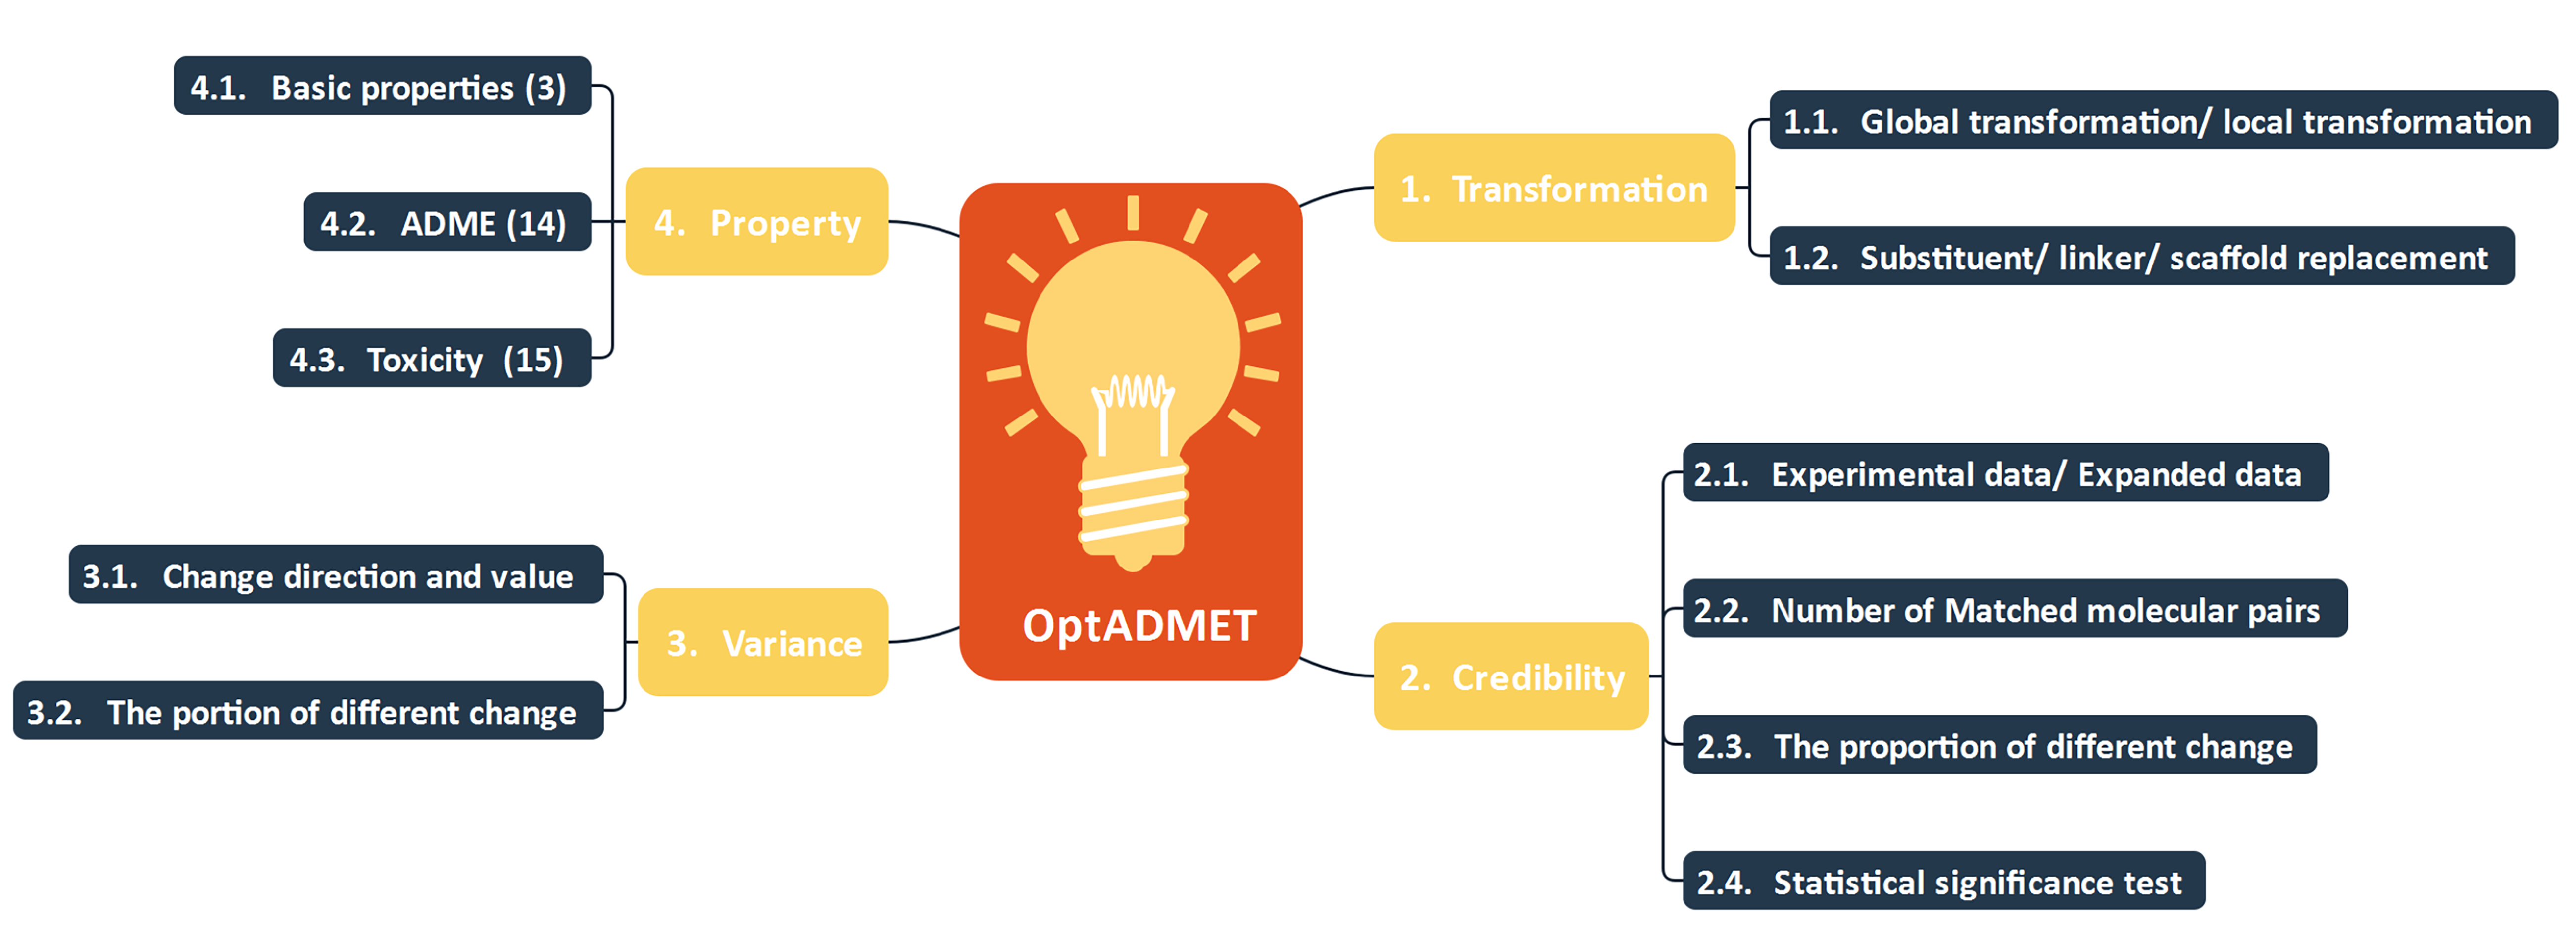
Fig 1. The constitute of OptADMET webserver
OptADMET webserver provides two functions: Database and Optimization.
Database
In the “Database” module, users can find the qualified chemical transformation of Single property or Multiple property, with requirements of data source, property and etc.
For Single Property transformation rules (Fig 2), users can click the picture to get more information, including ID, left fragment, right fragment, distribution, average change, the number of MMPs (count), statistical significance, local transformations summary table and experimental MMPs summary table. (Fig 3)

Fig 2. Single property filters

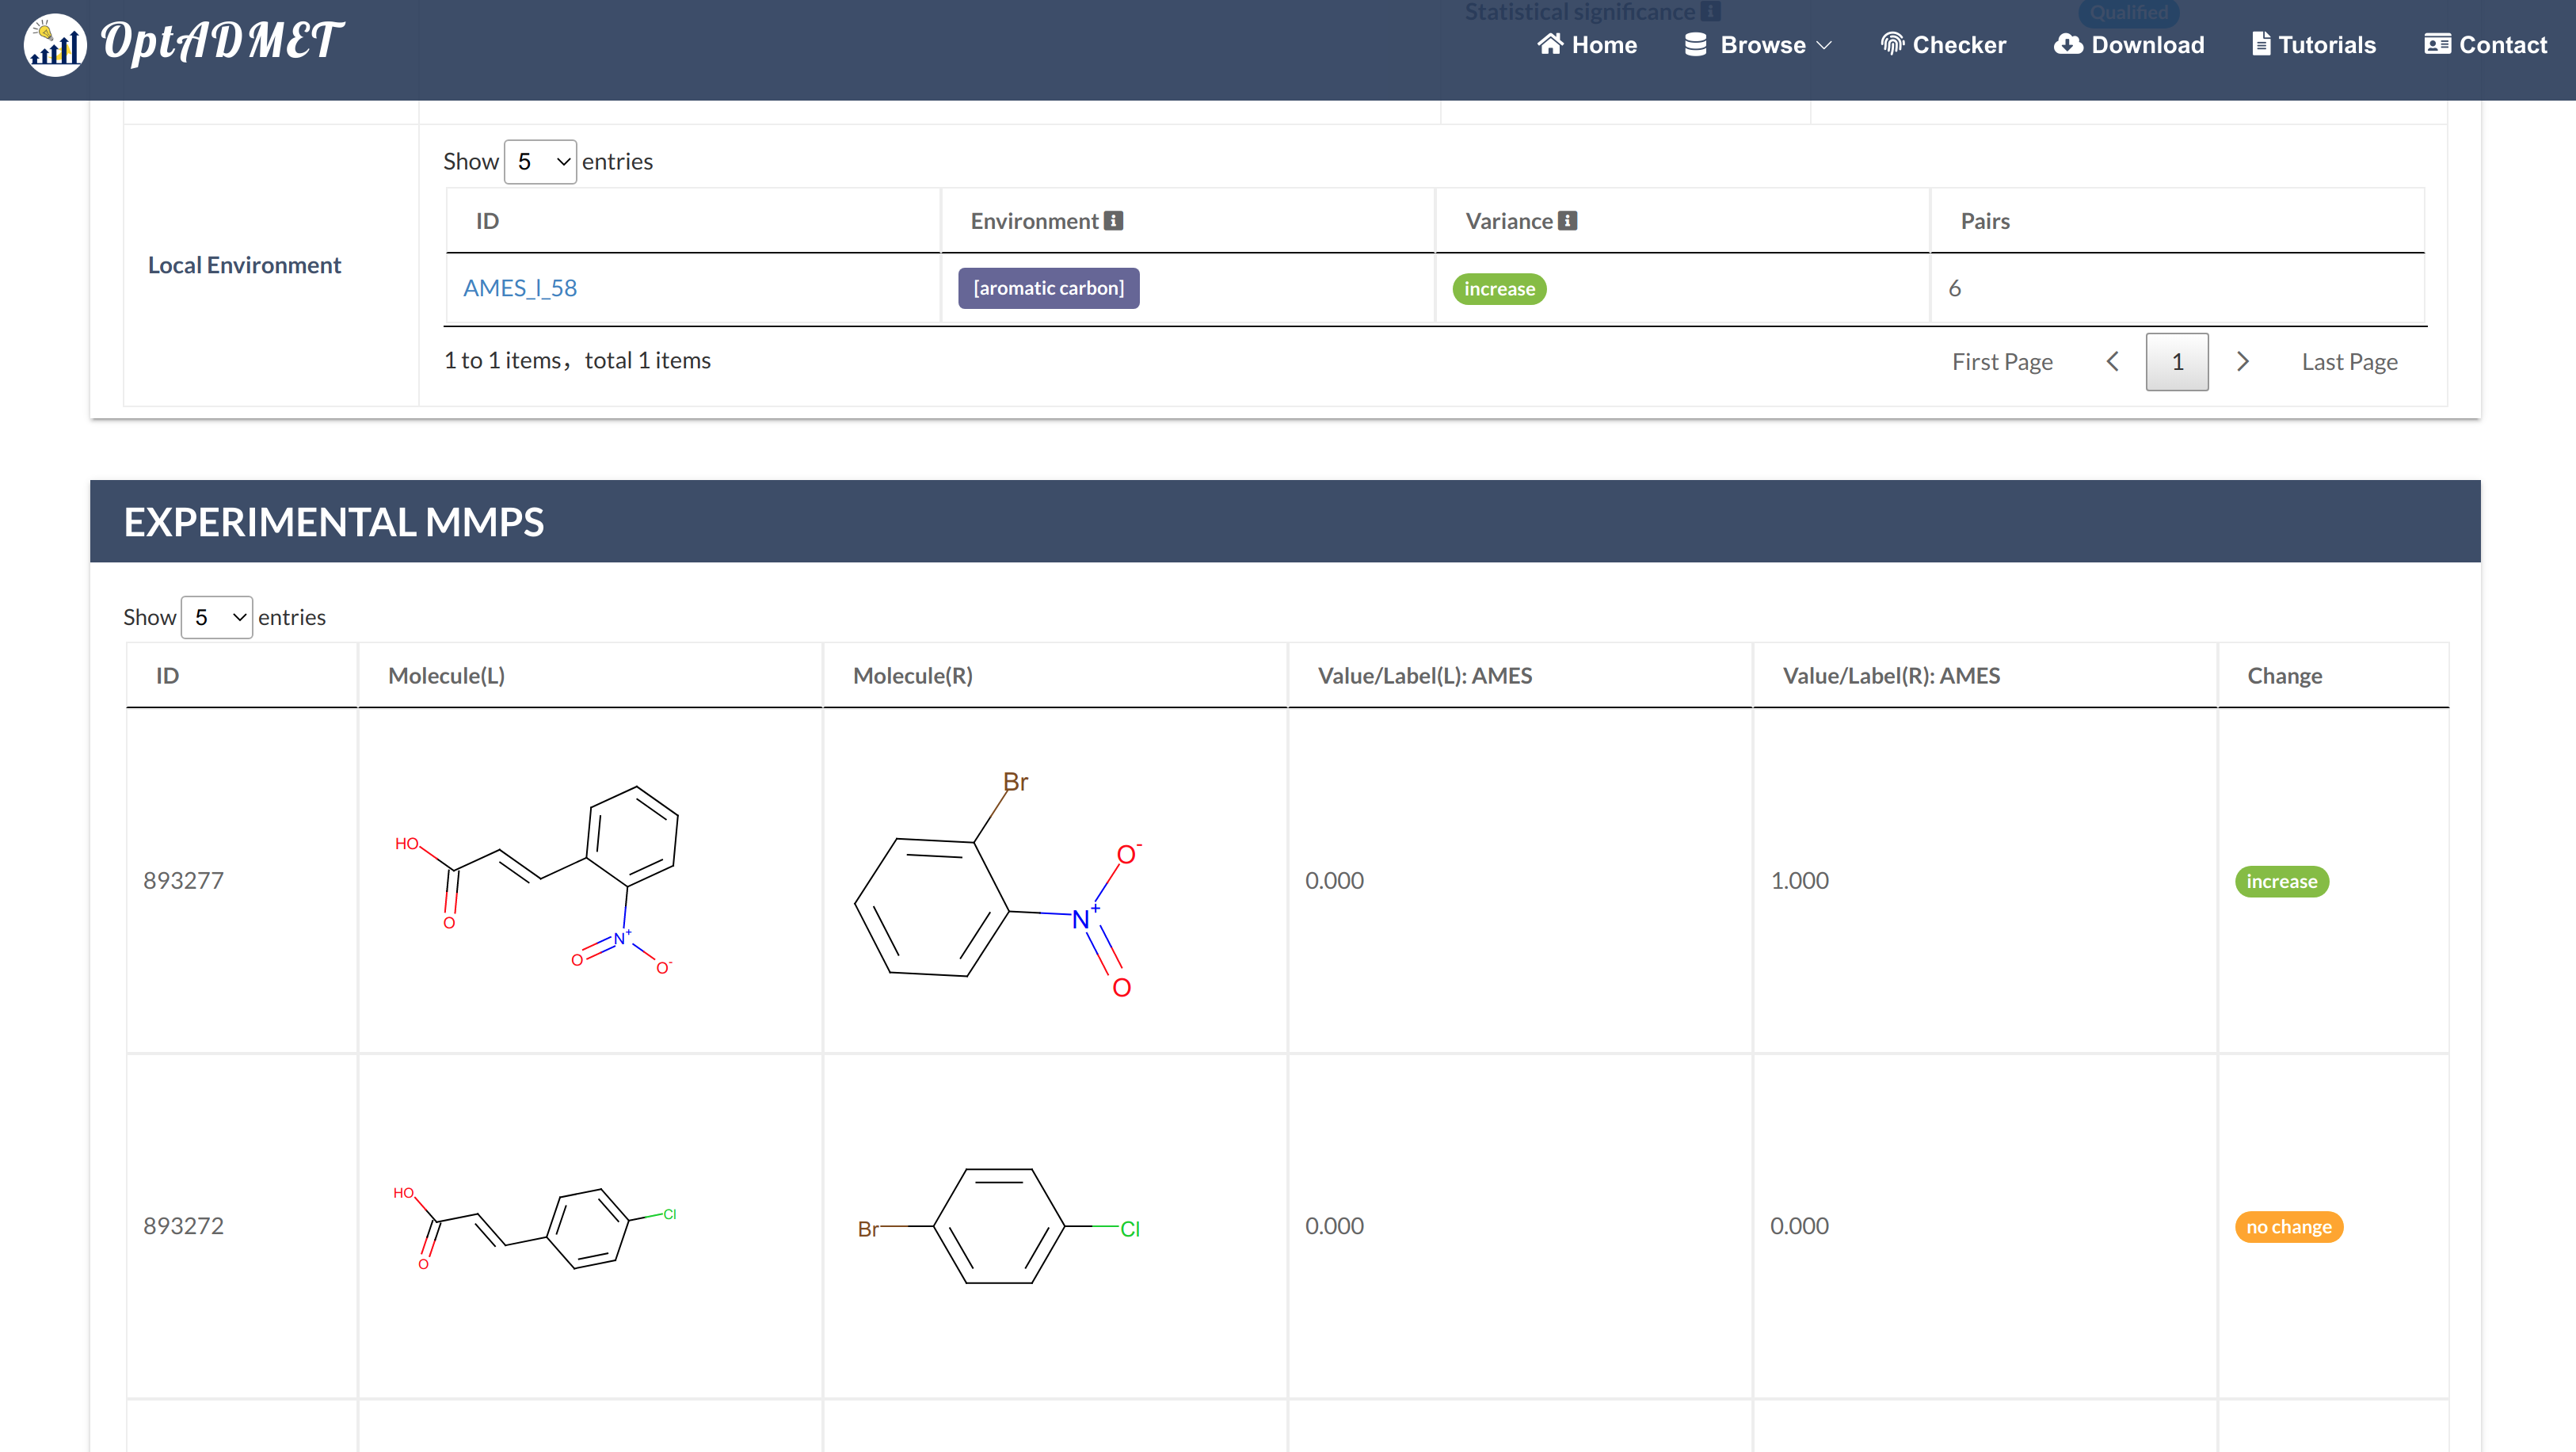
Fig 3. Detailed global rule information
By clicking the local transformation item more information about this local transformation will be provided, including ID, left fragment, right fragment, distribution, average change, the number of MMPs (count), statistical significance and experimental MMPs summary table. (Fig 4)

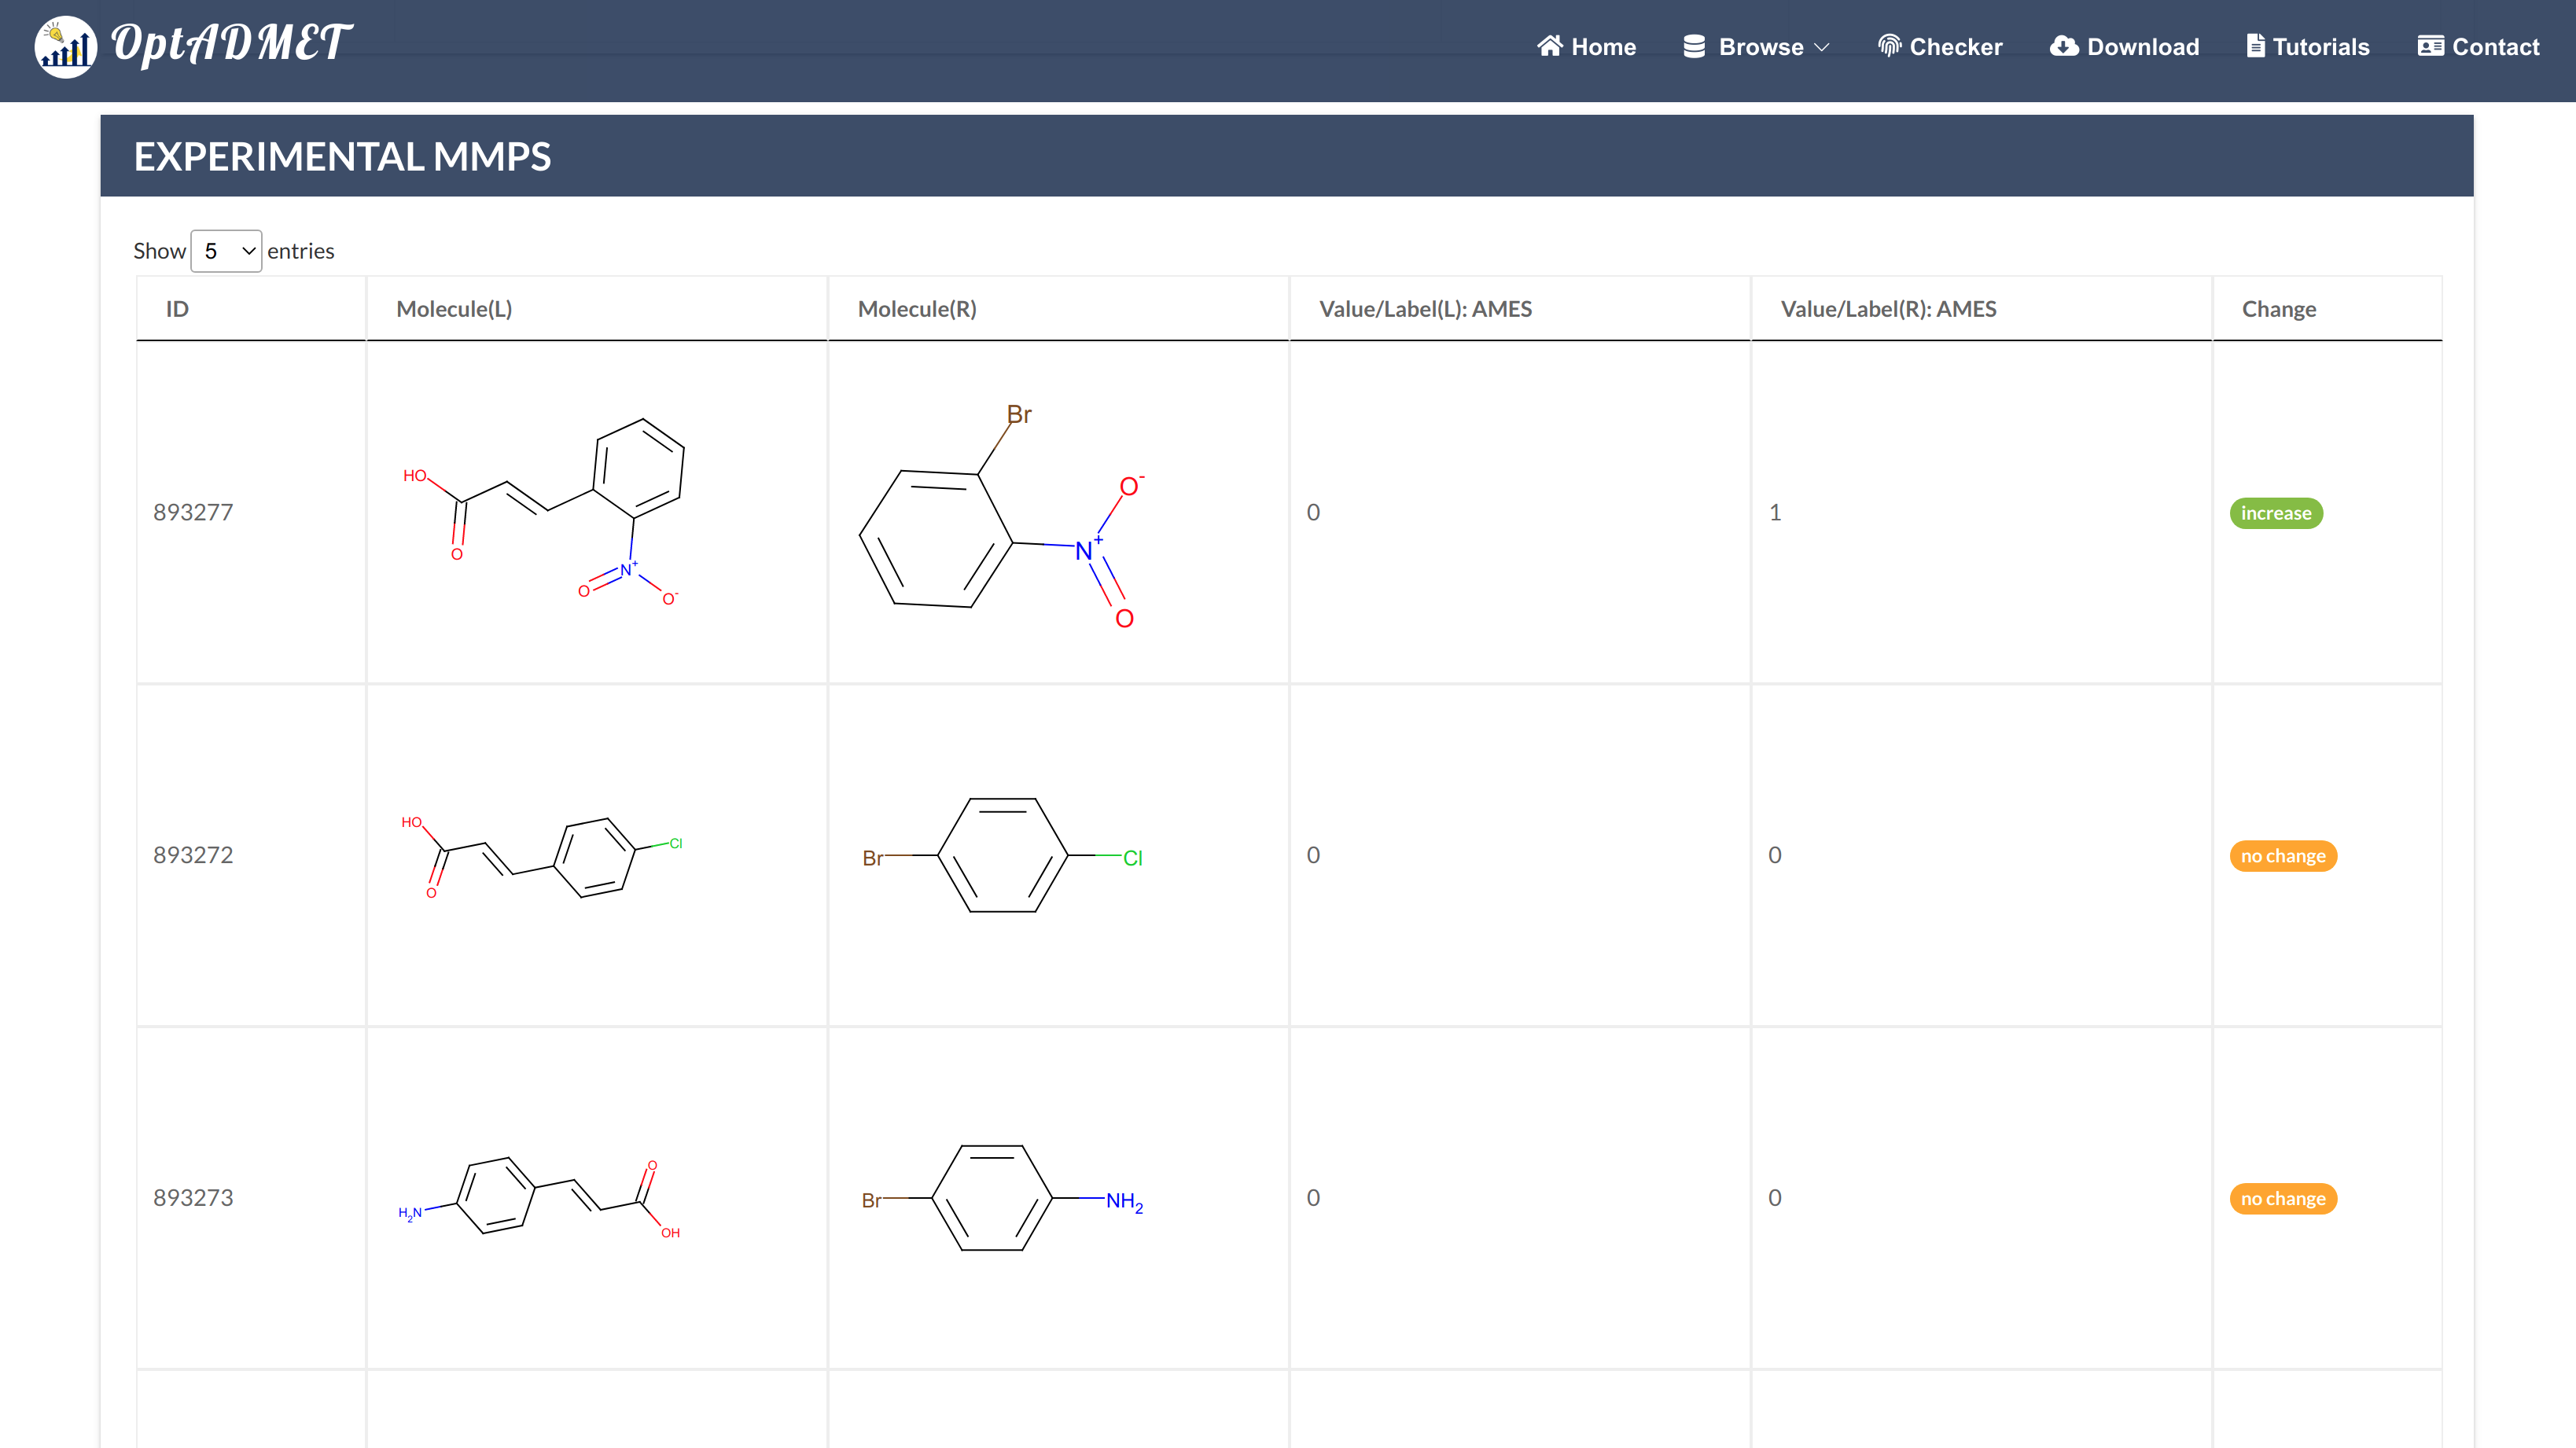
Fig 4. Detailed local rule information
For Multiple Property transformation rules, users can find the chemical transformation with the summary of multiple property information by selecting data source and property (maximum 2). (Fig 5)
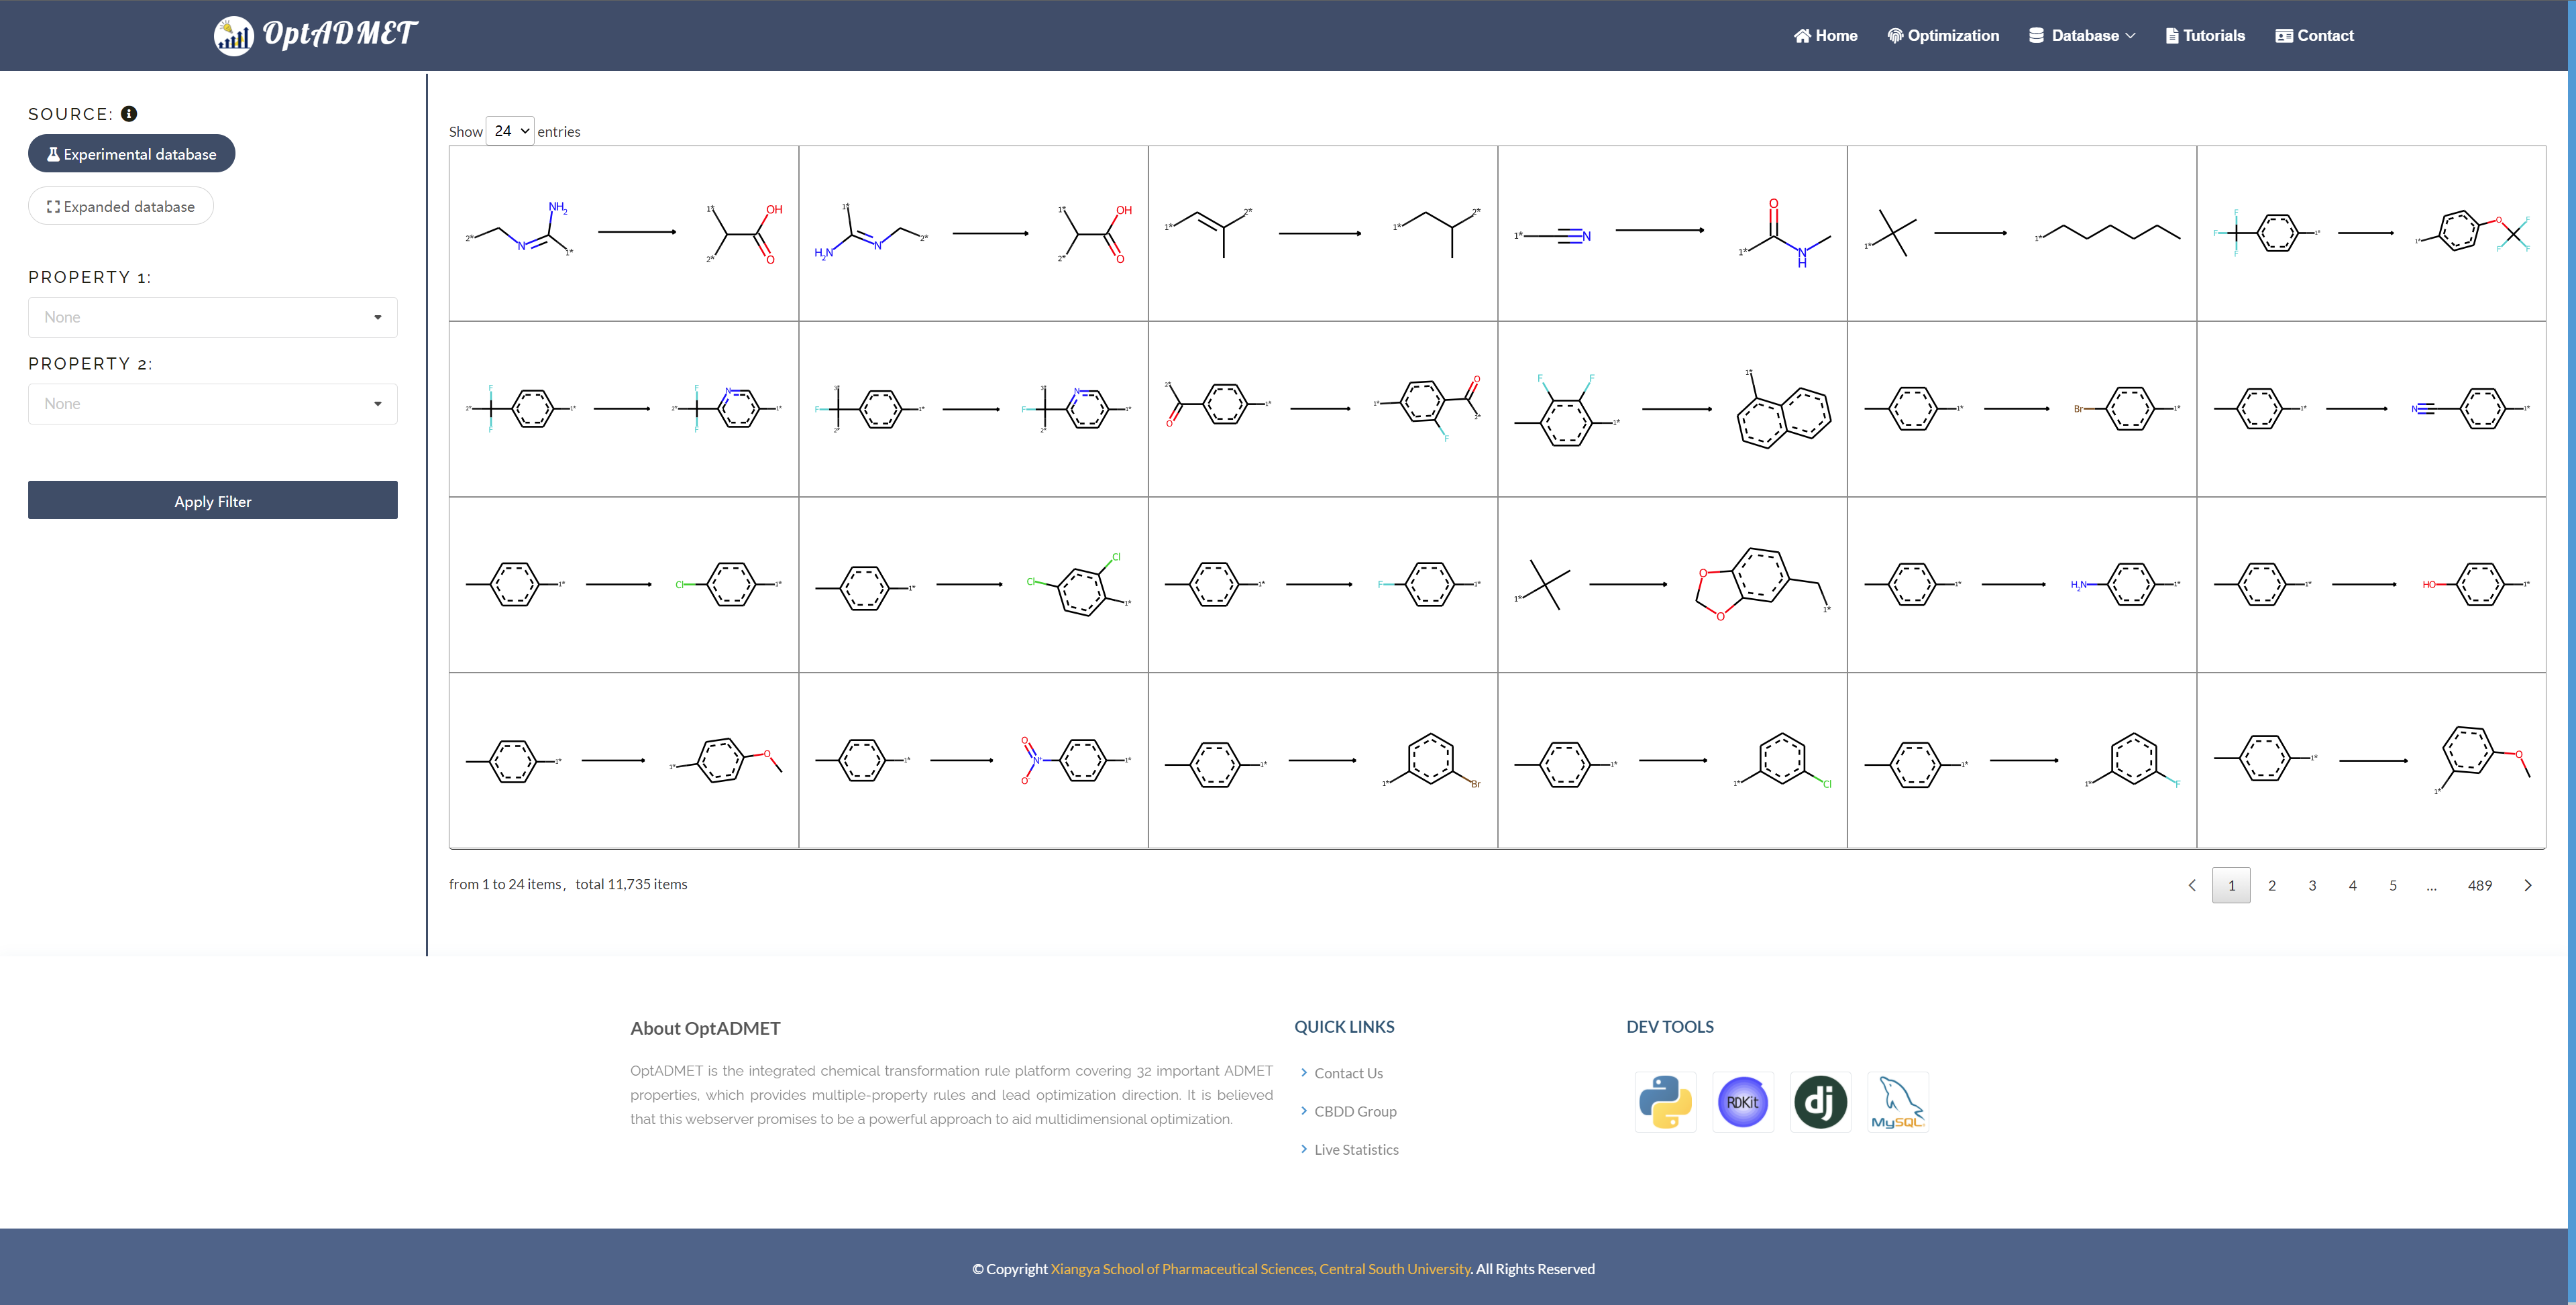
Fig 5. Multiple property filters
By clicking the picture, more information about this rule will be provided, including ID, left fragment, right fragment, the property variance summary of the global rule and the property variance summary of the local transformation. (Fig 6)
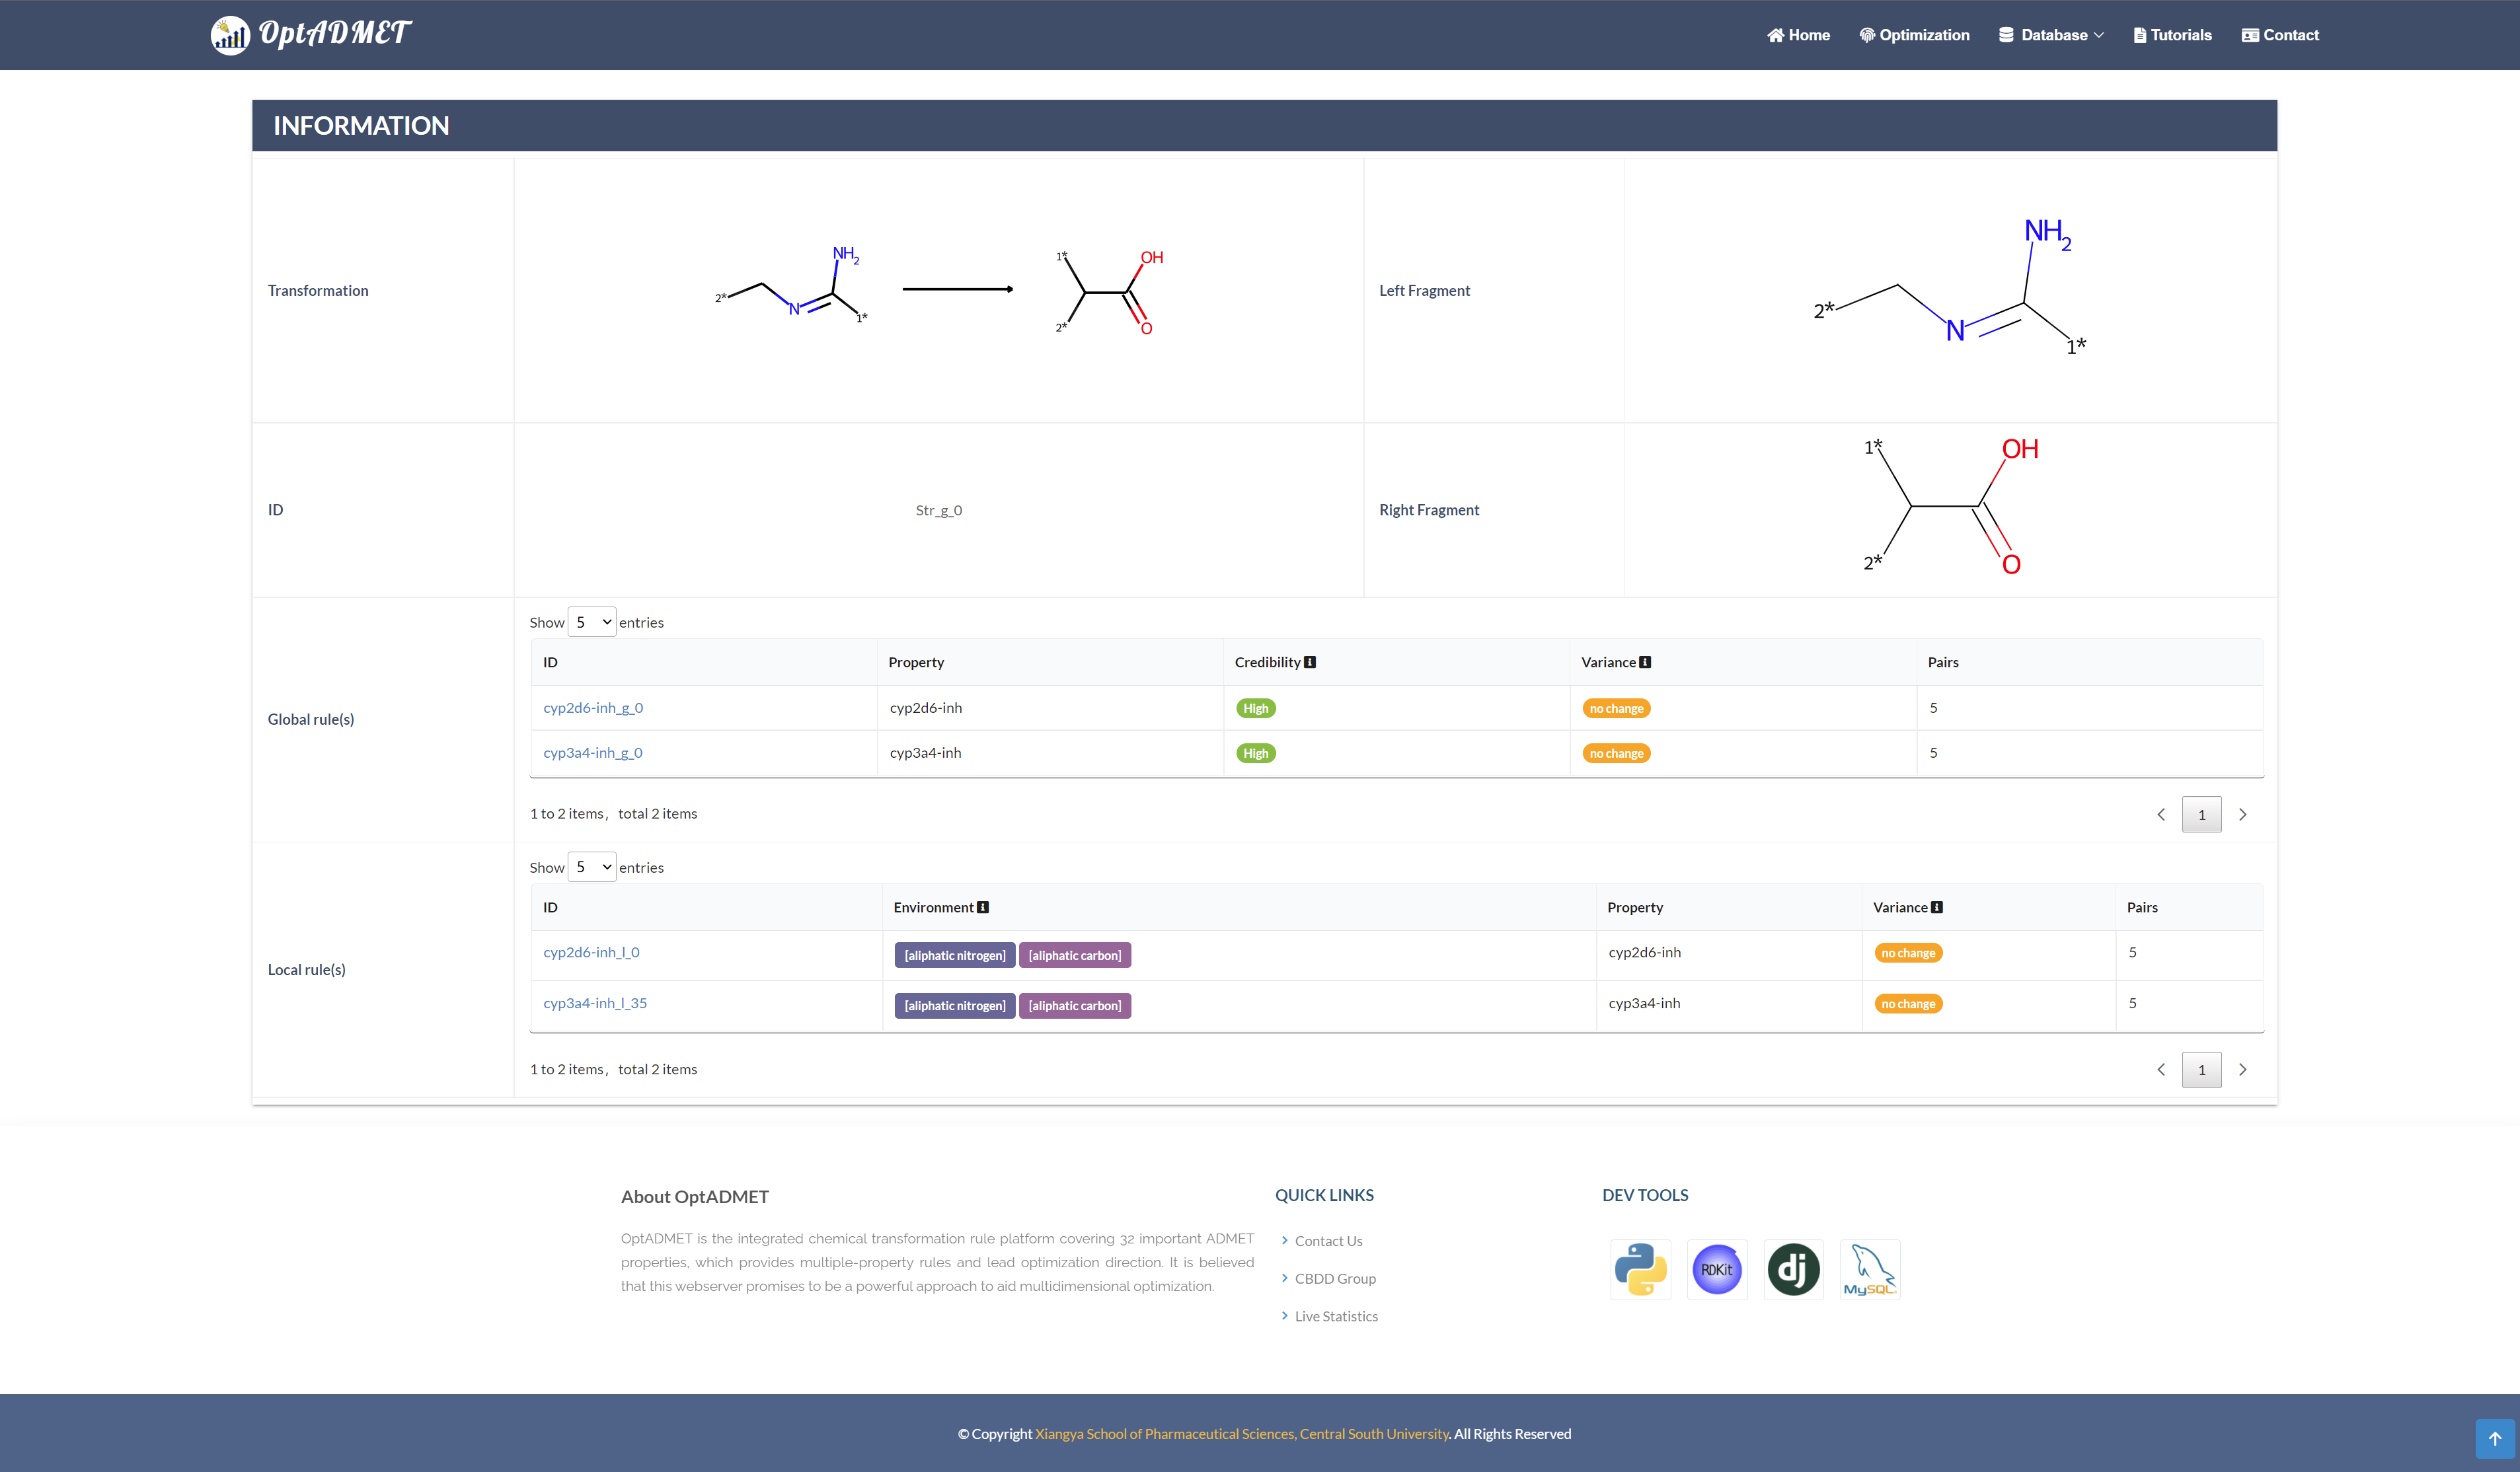
Fig 6. Detailed rule information
Optimization
In the “Optimization” module, users can optimize the initial molecule with regards to a number of ADMET properties. Two molecule input types are provided: 1. input single SMILES string; 2. draw molecule from Editor below. Along with query molecule, users can choose transformation rules from experimental or expanded database, with maximum two properties. (Fig 7)
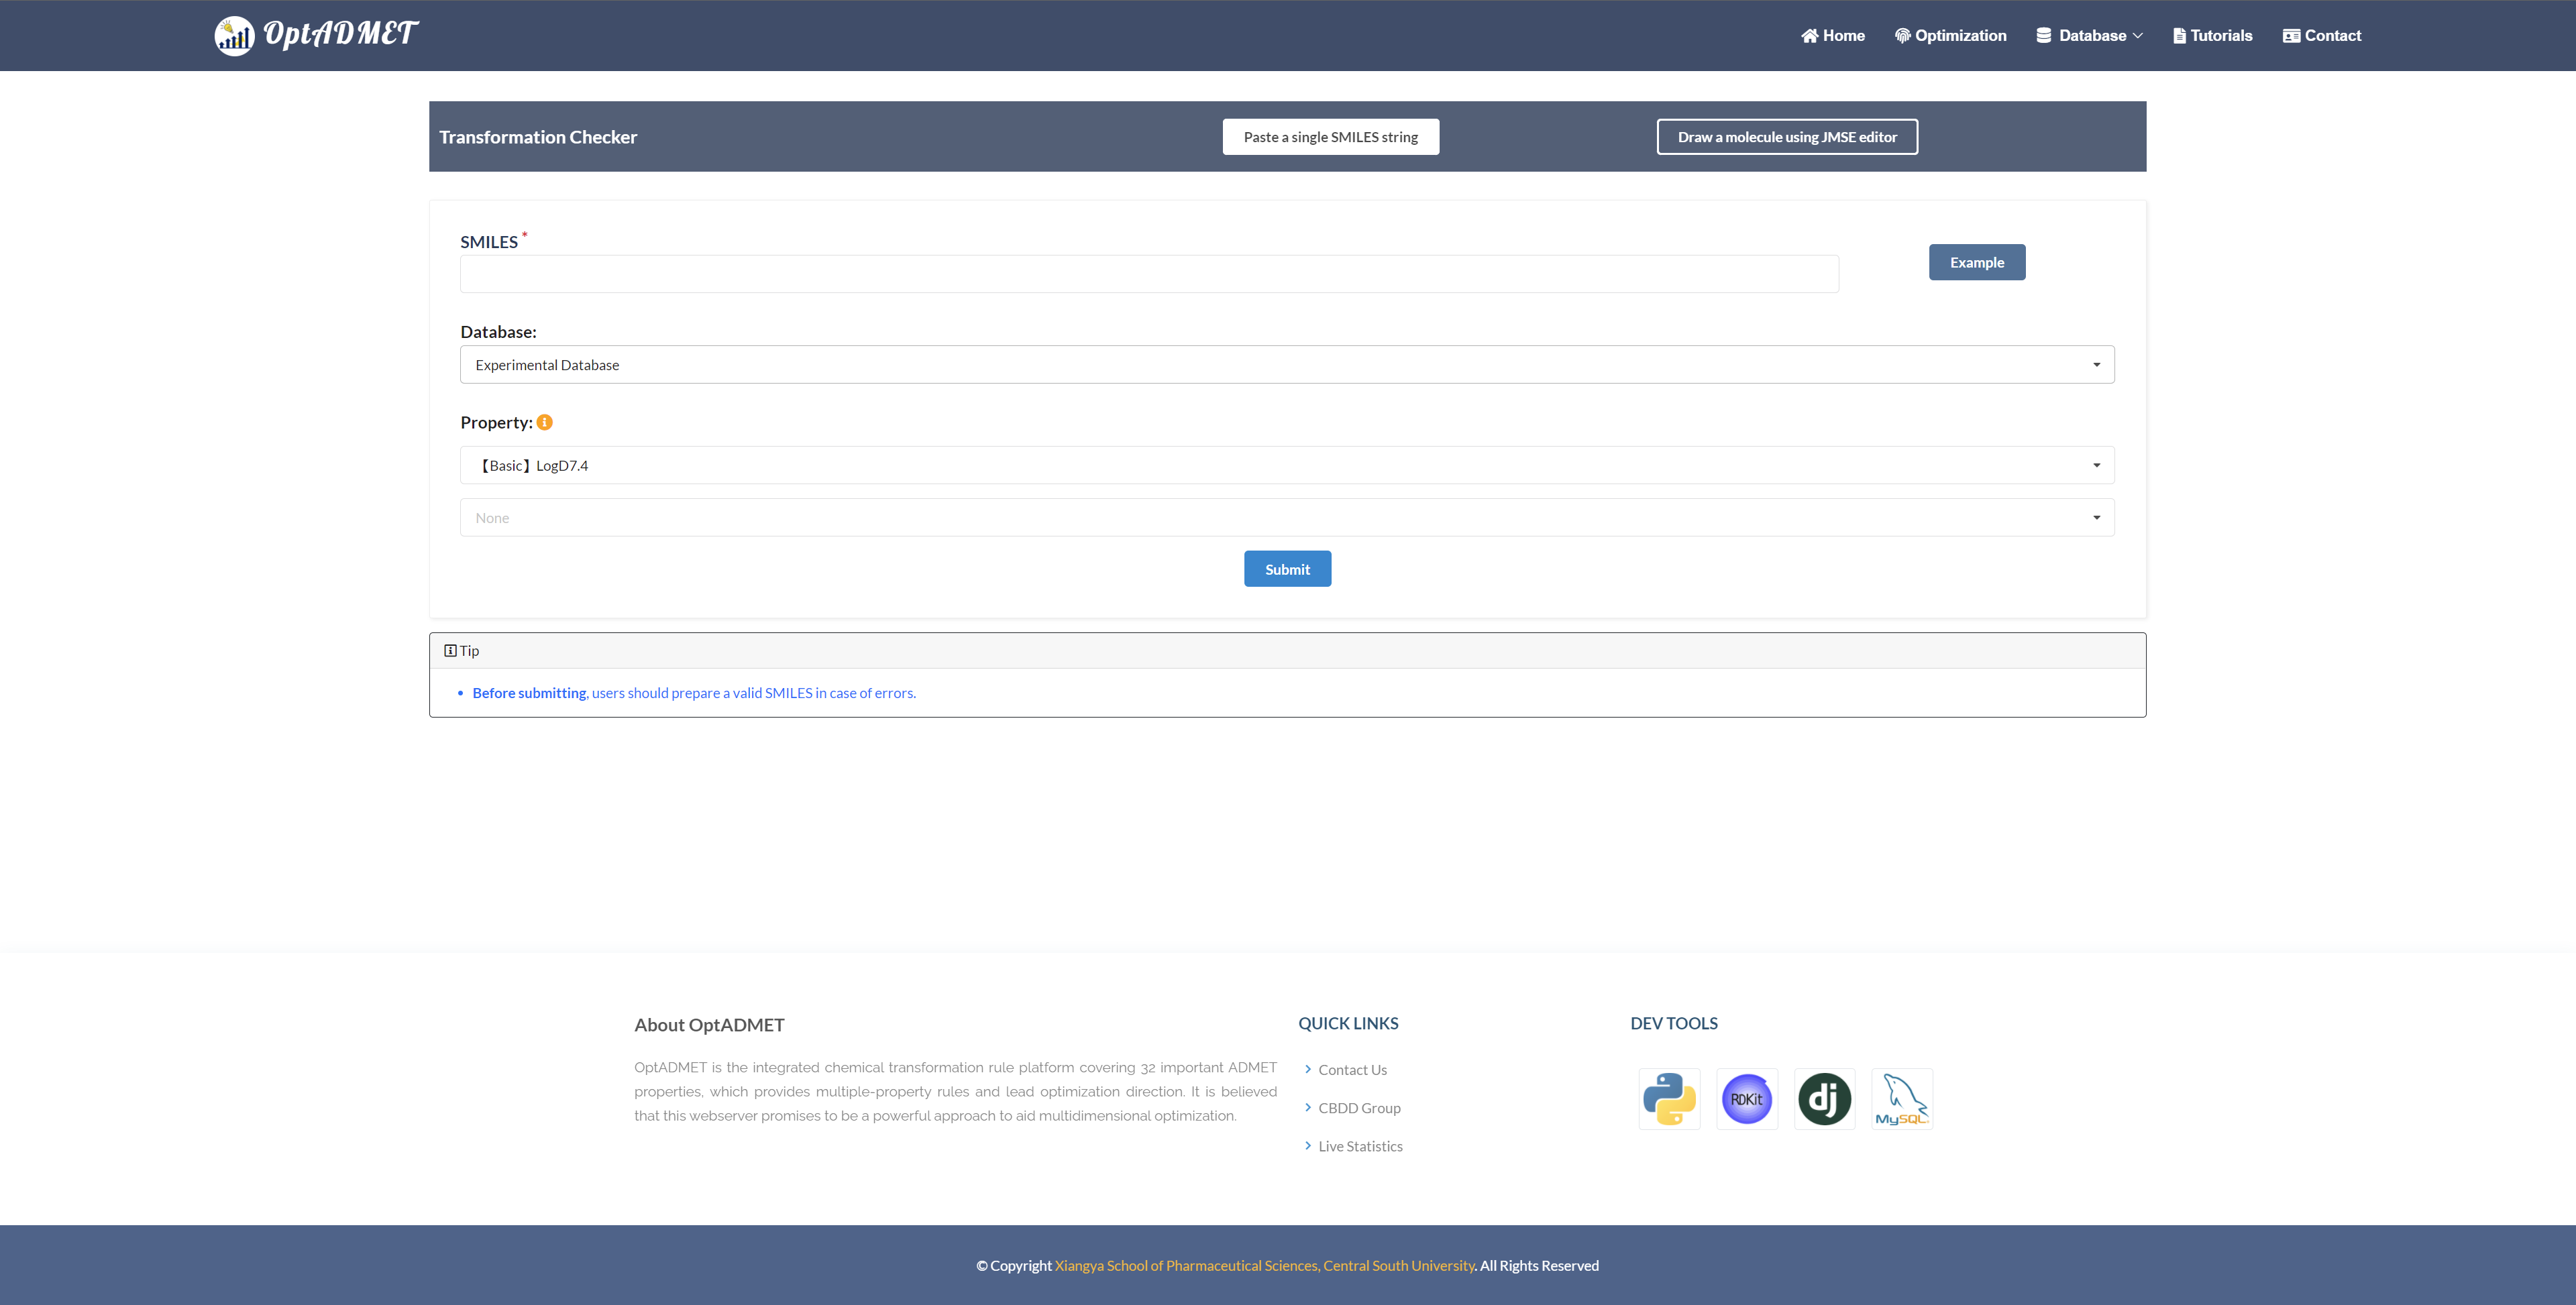
Fig 7. Checker module
After submission, the Summary and Generated block will present the overview of the optimization results and the detailed information about the chemical transformation rules. (Fig 8)
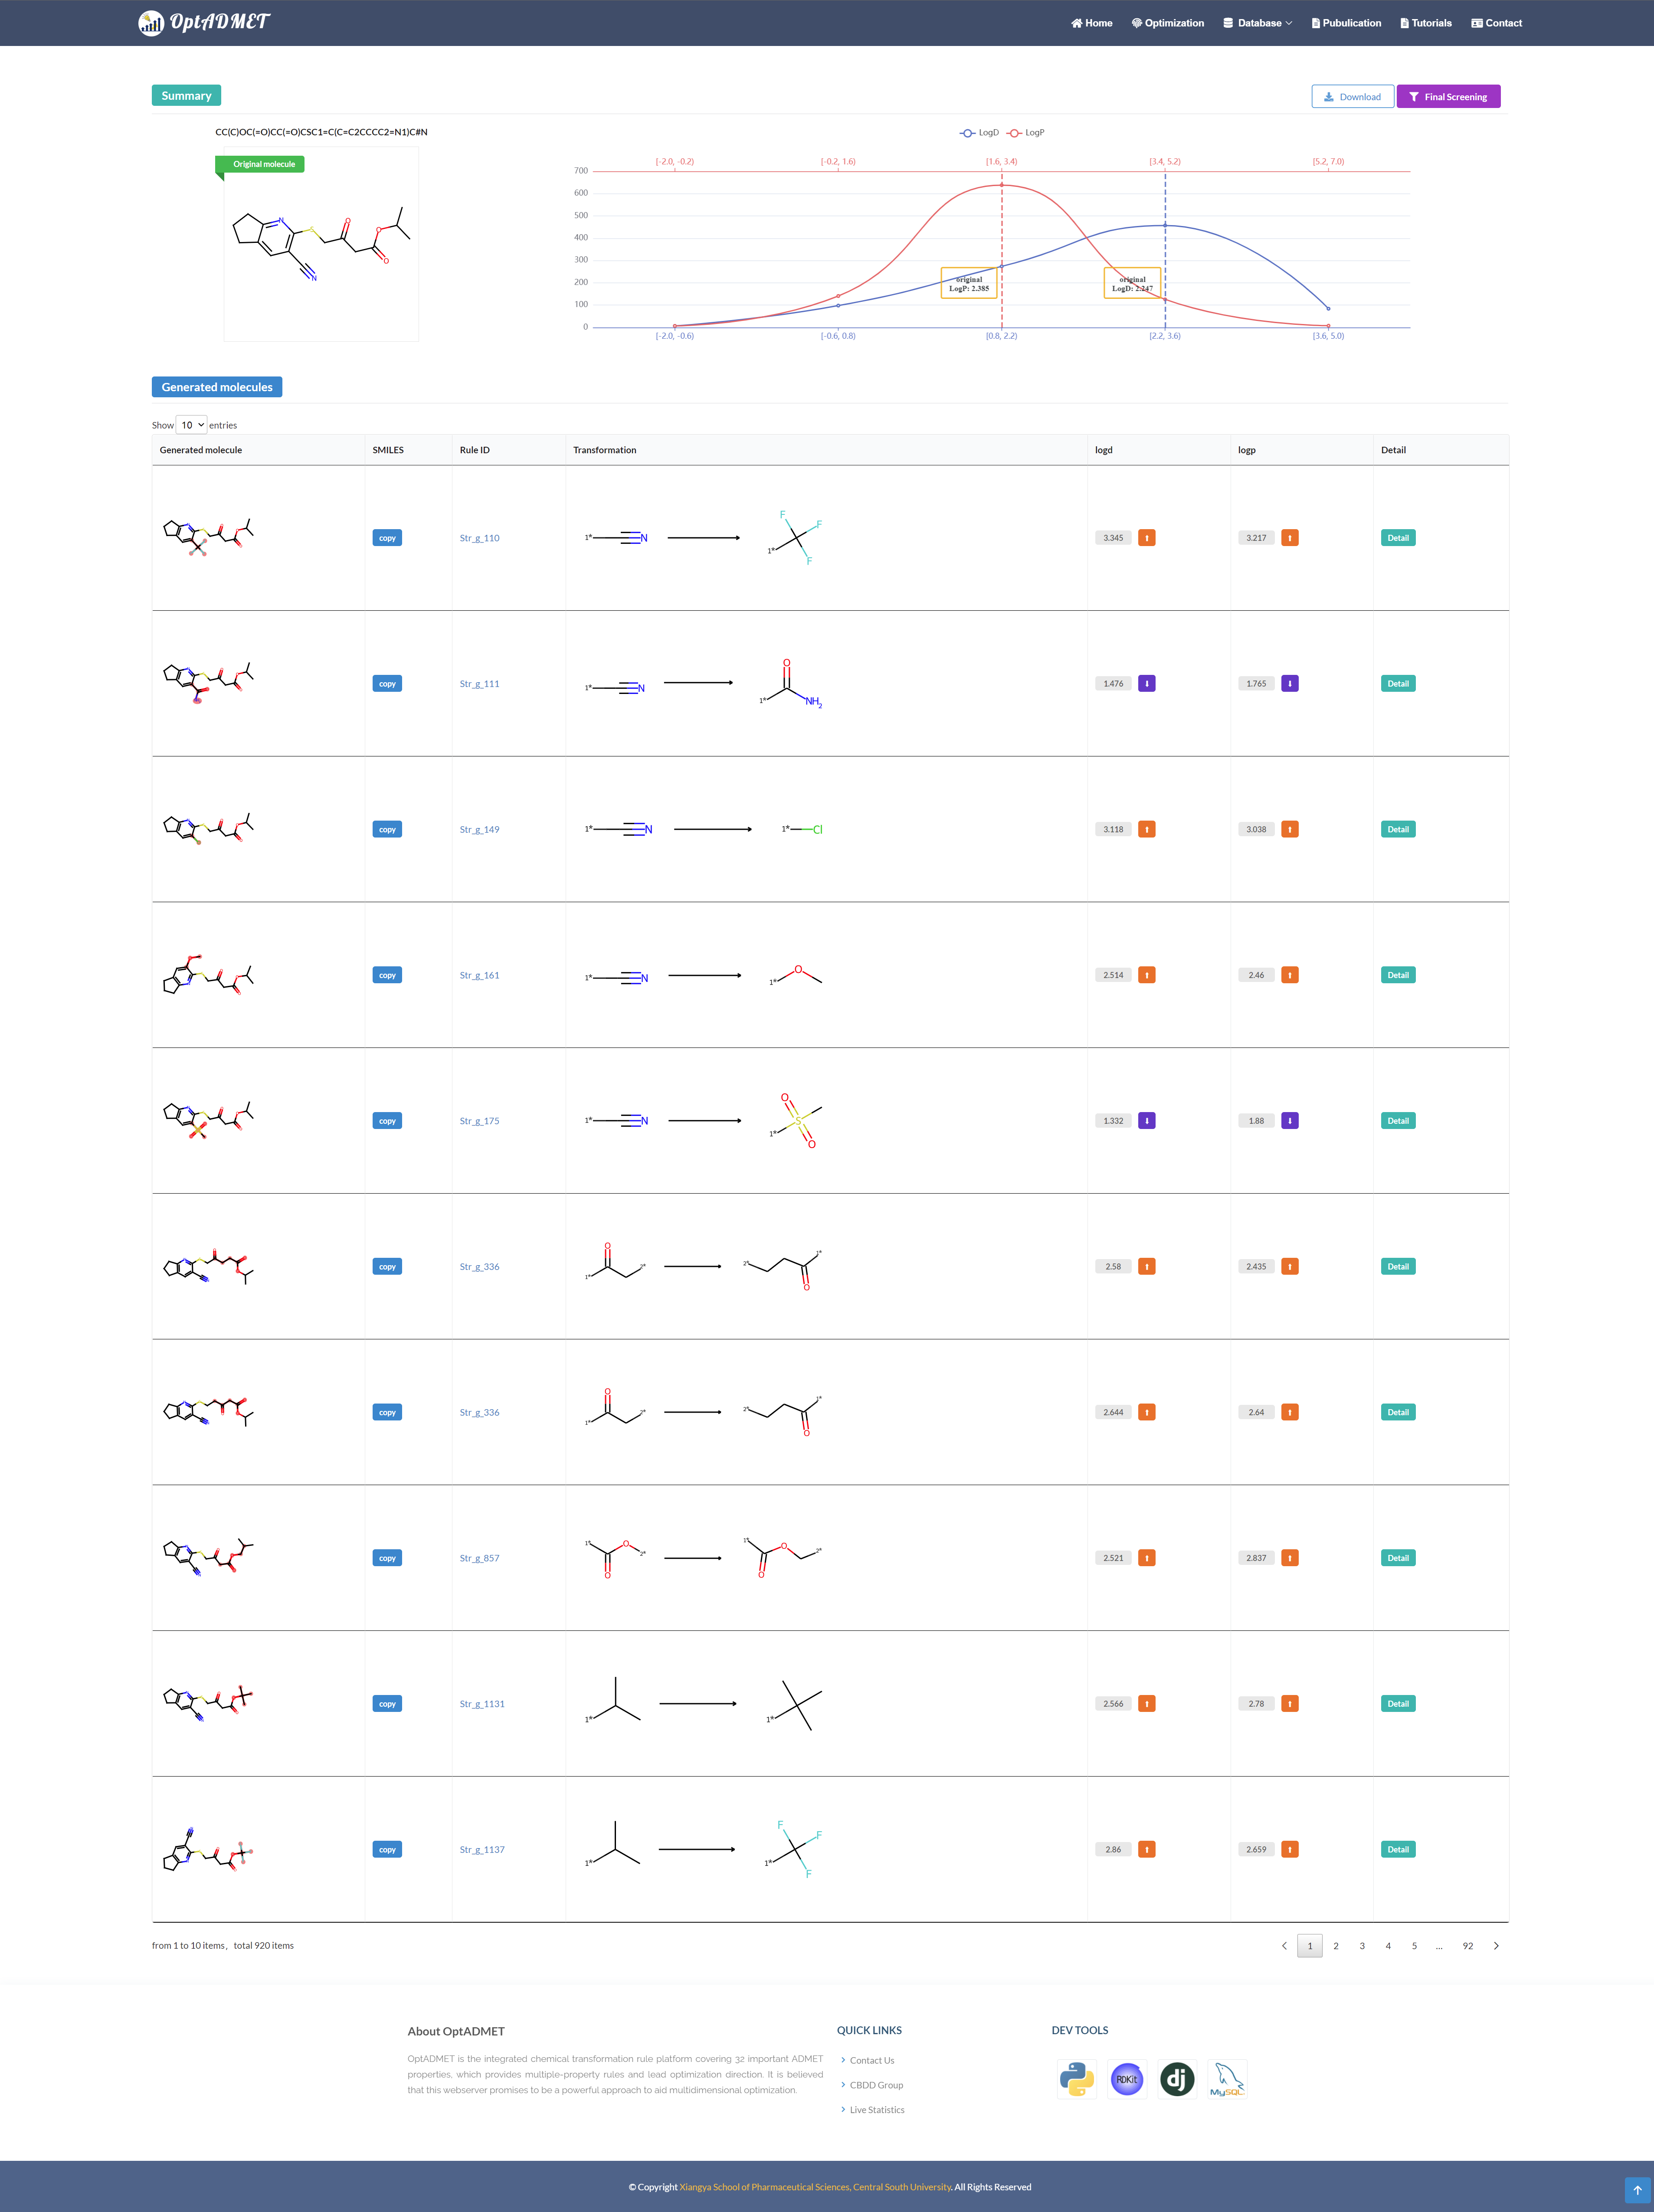
Fig 8. The result page of Optimization module
In the Summary block, the information of the original molecule and the distribution of the optimized molecules will be provided.
In the Generated molecule block, the detailed information about optimized molecule and related transformation rule will be provided. By clicking the picture, more information about this rule will be provided, including ID, left fragment, right fragment, the property variance summary of the global rule and the property variance summary of the local transformation. (Fig 9) Besides, to benefit the comprehensive evaluation, the ADMET profile of the optimized molecule will be provided by clicking the Detail. (Fig 10)
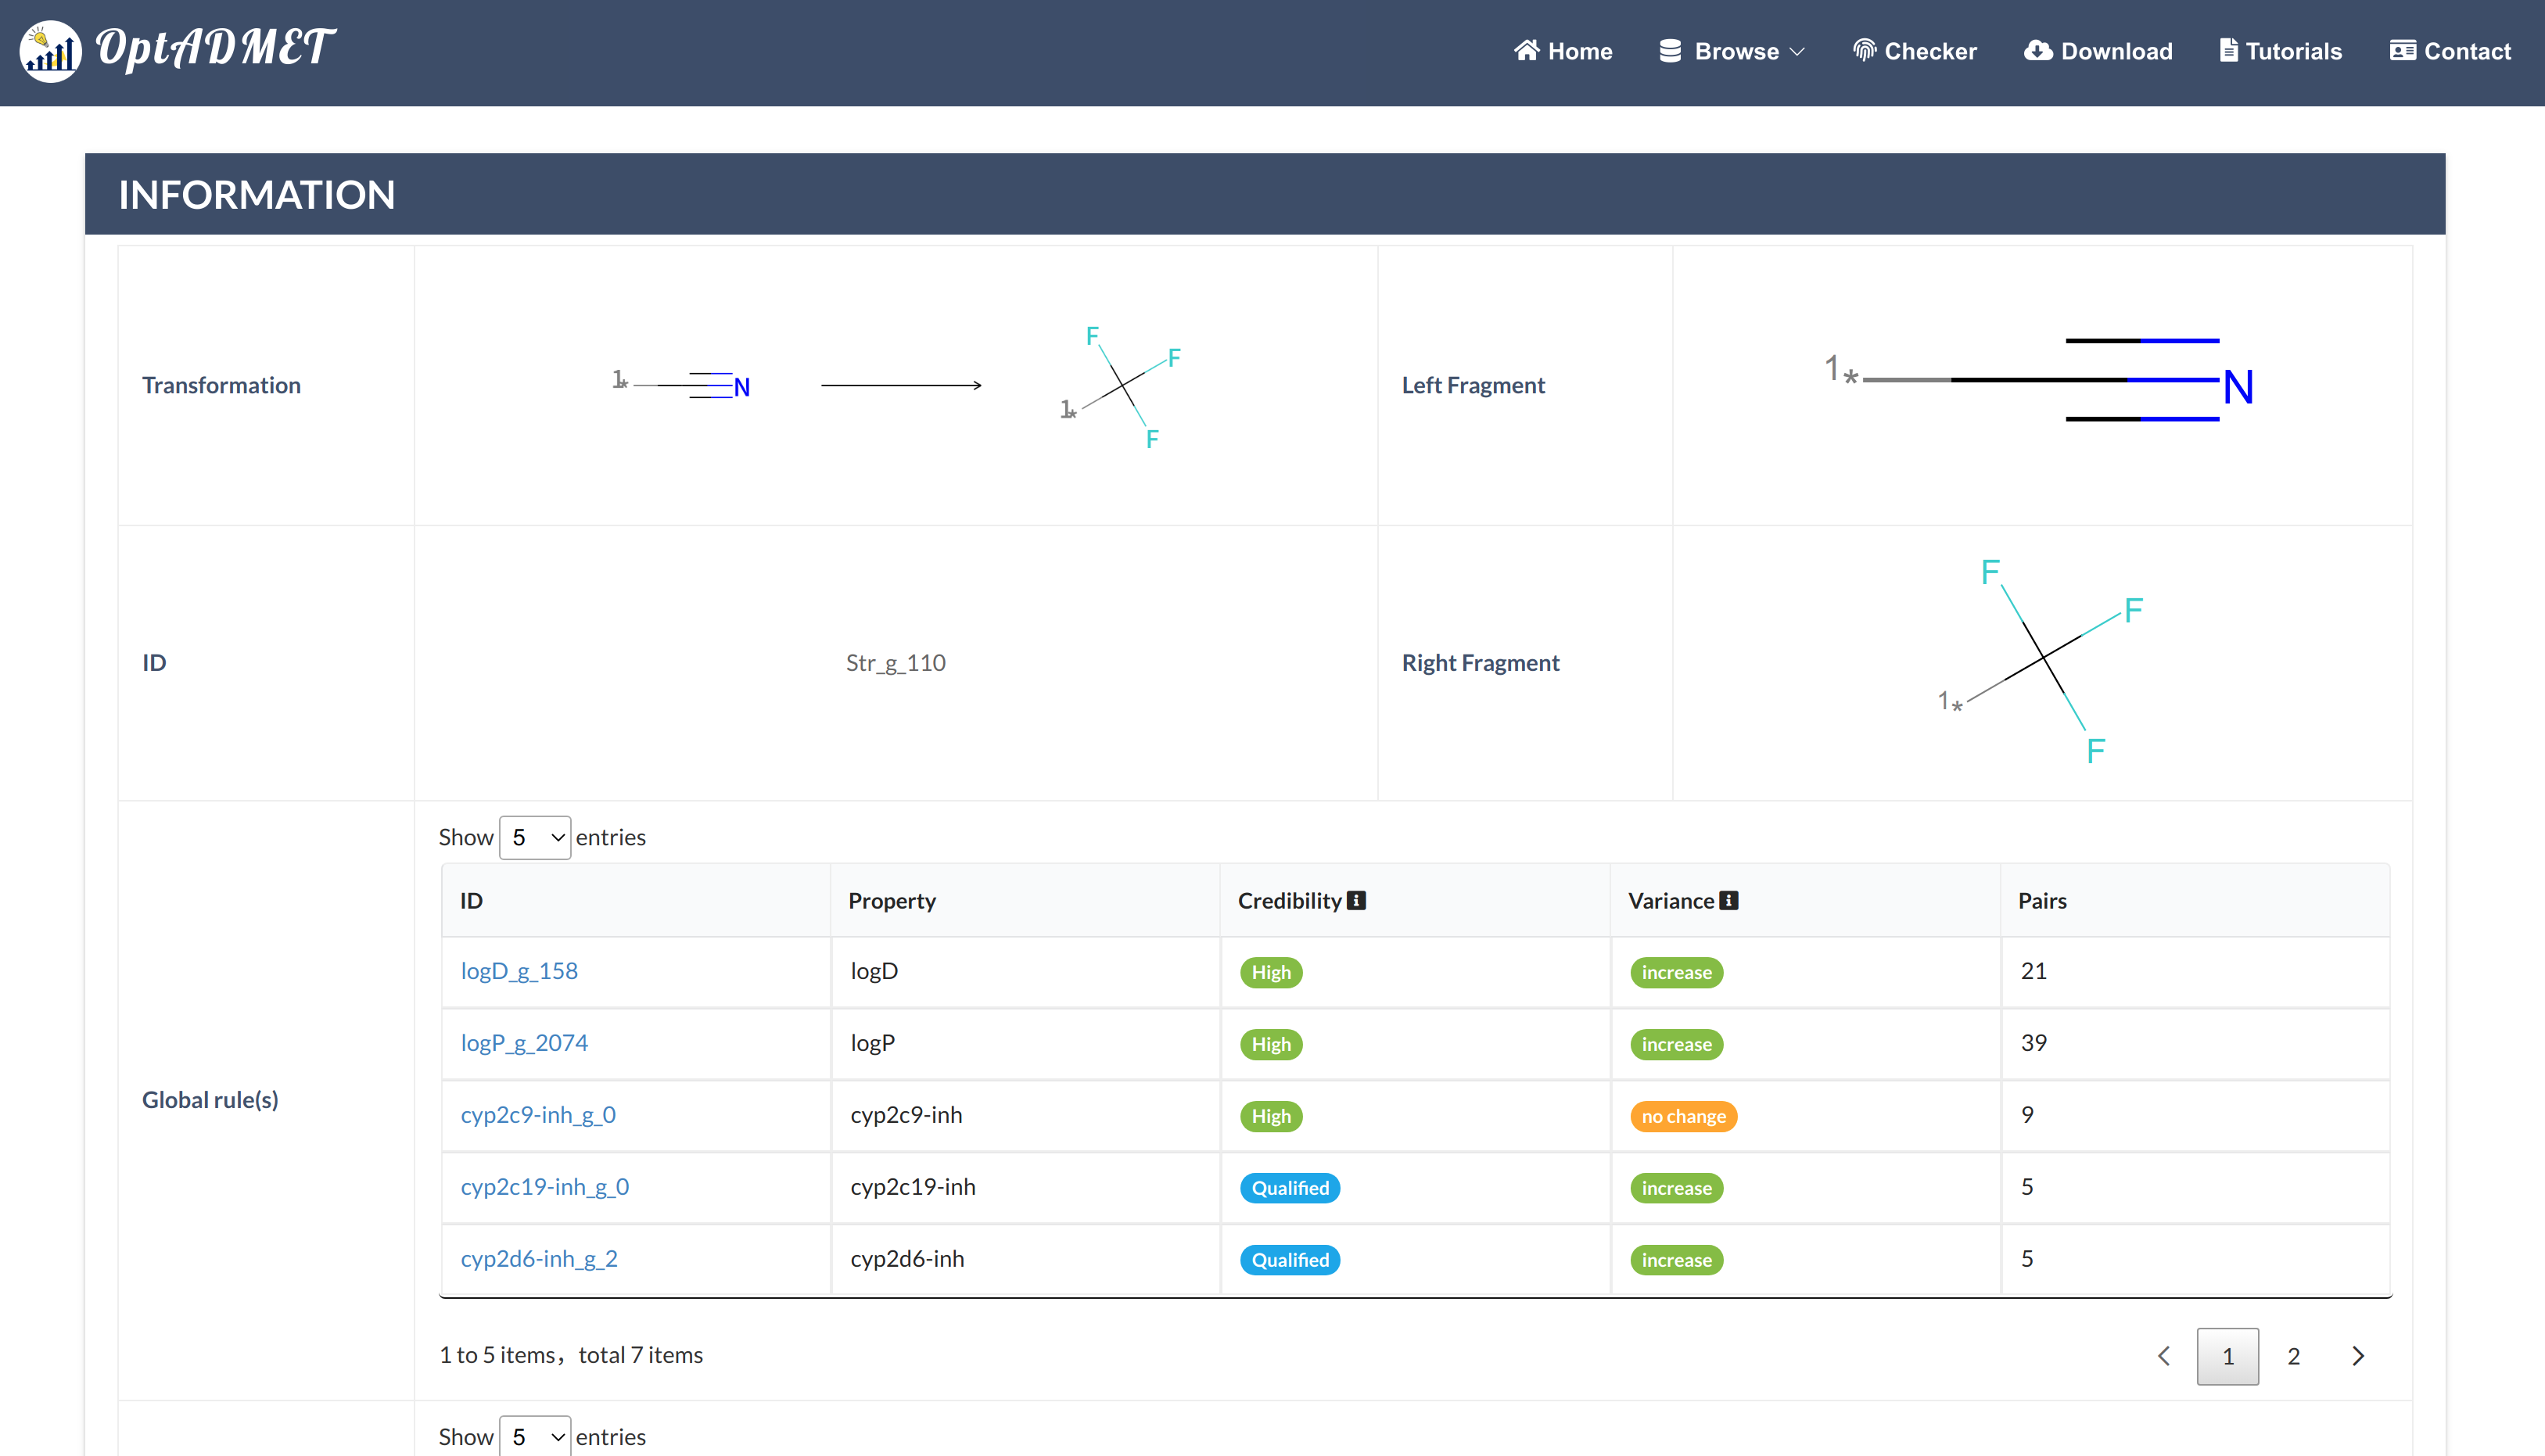
Fig 9. Checker results
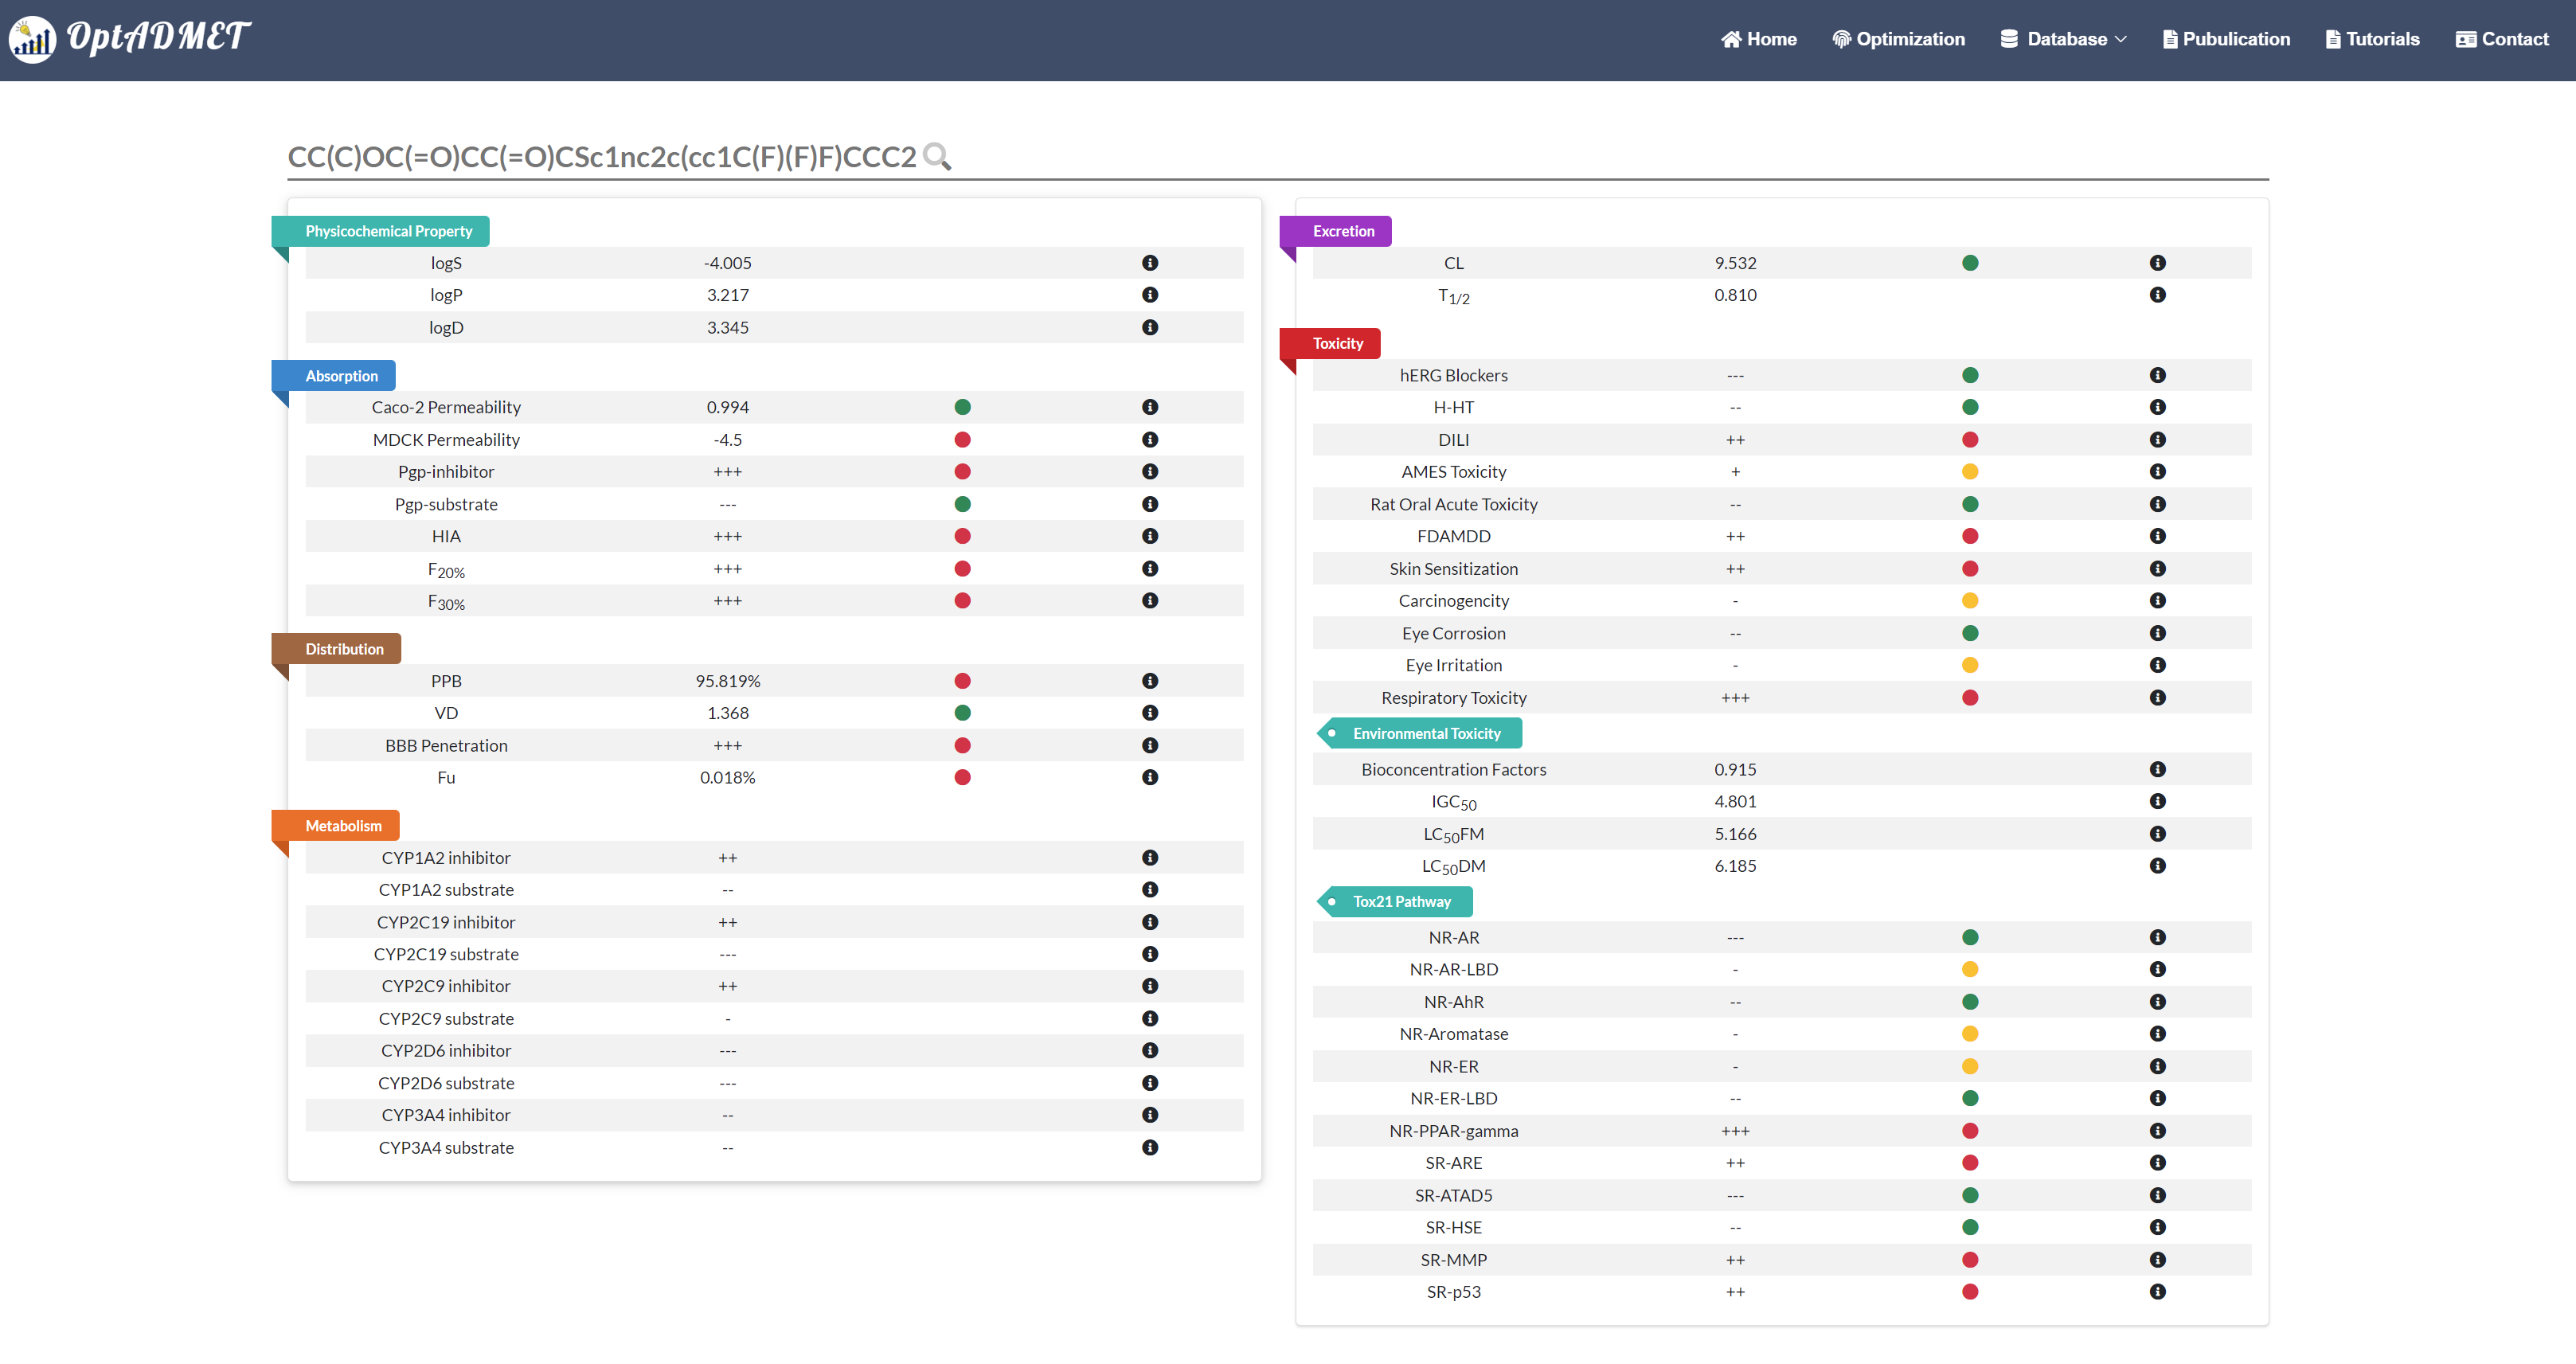
Fig 10. The ADMET profile of the optimized molecule
To achieve the multi-property task, users can choose concerned ADMET properties for further screening. The empirical-based ADMET property interval is summarized in Table 1.
Table1. The data information about OptADMET database
| Type | Endpoint | Property interval | Unit |
|---|---|---|---|
| Basic | LogD7.4 | 1≤value≤3 | log mol/L |
| Basic | LogP | 0≤value≤3 | log mol/L |
| Basic | LogS | -4≤value≤0.5 | log mol/L |
| Absorption | Caco-2 | –5.15≤value | log cm/s |
| Absorption | Pgp-inhibitor | 0≤value≤0.3 | probability |
| Absorption | Pgp-substrate | 0≤value≤0.3 | probability |
| Absorption | F (30%) | 0≤value≤0.3 | probability |
| Distribution | PPB | value<0.9 | probability |
| Distribution | BBB | 0≤value≤0.3 | probability |
| Distribution | vdss | 0.04≤value≤20 | L/kg |
| Metabolism | CYP 1A2-inhibitor | value≤0.5 | probability |
| Metabolism | CYP 2C19-inhibitor | value≤0.5 | probability |
| Metabolism | CYP 2C9-inhibitor | value≤0.5 | probability |
| Metabolism | CYP 2D6-inhibitor | value≤0.5 | probability |
| Metabolism | CYP 2d6-substrate | value≤0.5 | probability |
| Metabolism | CYP 3A4-inhibitor | value≤0.5 | probability |
| Excretion | T1/2 | value≤0.5 | probability |
| Toxicity | Ames | 0≤value≤0.3 | probability |
| Toxicity | BCF | value≤0.5 | probability |
| Toxicity | DILI | value≤0.5 | probability |
| Toxicity | EC | value≤0.5 | probability |
| Toxicity | EI | value≤0.5 | probability |
| Toxicity | FDAMDD | value≤0.5 | probability |
| Toxicity | H-HT-2 | value≤0.5 | probability |
| Toxicity | hERG | value≤0.5 | probability |
| Toxicity | IGC50 | value≤0.5 | probability |
| Toxicity | NR-AhR | value≤0.5 | probability |
| Toxicity | NR-AR | value≤0.5 | probability |
| Toxicity | NR-AR-LBD | value≤0.5 | probability |
| Toxicity | Respiratory | value≤0.5 | probability |
| Toxicity | SR-ARE | value≤0.5 | probability |
| Toxicity | SR-MMP | value≤0.5 | probability |
Explanation-Property
1. Physical properties
LogS: The logarithm of aqueous solubility value. The first step in the drug absorption
process is the
disintegration of the tablet or capsule, followed by the dissolution of the active drug. Low solubility
is detrimental to oral absorption, and early measurement of this property is of great importance in drug
discovery.
Change explanation: Increase means the transformation from left to right will increase
the value of LogS
(△≥+0.3), while Decrease means the transformation from left to right will decrease the value of LogS
(△≤-0.3). No change means there is no change of the value (-0.3<△<+0.3).
LogP: The logarithm of the n-octanol/water distribution coefficient. logP possess a
leading position
with considerable impact on both membrane permeability and hydrophobic binding to macromolecules,
including the target receptor as well as other proteins like plasma proteins, transporters, or
metabolizing enzymes.
Change explanation: Increase means the
transformation from left to
right will increase
the value of LogP (△≥+0.3), while Decrease means the
transformation from left to right
will decrease the
value of LogP (△≤-0.3). No change means there is no change of
the
value (-0.3<△<+0.3).
LogD7.4: The logarithm of the n-octanol/water distribution coefficients at pH=7.4. To
exert a therapeutic effect, one drug must enter the blood circulation and then reach the site of action.
Thus, an eligible drug usually needs to keep a balance between lipophilicity and hydrophilicity to
dissolve in the body fluid and penetrate the biomembrane effectively. Therefore, it is important to
estimate the n-octanol/water distribution coefficients at physiological pH (logD7.4) values for
candidate compounds in the early stage of drug discovery.
Change explanation: Increase means the
transformation from left to right will increase
the value of LogD7.4 (△≥+0.3), while Decrease means the
transformation from left to right will
decrease
the value of LogD7.4 (△≤-0.3). No change means there is no
change of the value (-0.3<△<+0.3).
2. Absorption
Caco-2 Permeability: Before an oral drug reaches the systemic circulation, it must pass
through intestinal cell membranes via passive diffusion, carrier-mediated uptake or active transport
processes. The human colon adenocarcinoma cell lines (Caco-2), as an alternative approach for the human
intestinal epithelium, has been commonly used to estimate in vivo drug permeability due to their
morphological and functional similarities. Thus, Caco-2 cell permeability has also been an important
index for an eligible candidate drug compound.
Change explanation: Increase means the
transformation from left to right will increase
the value of Caco-2 Permeability (△≥+0.3), while Decrease
means the transformation from left to right
will decrease the value of Caco-2 Permeability (△≤-0.3). No
change means there is no change of the
value
(-0.3<△<+0.3).
Pgp inhibitor: The inhibitor of P-glycoprotein. The P-glycoprotein, also known as MDR1
or 2 ABCB1, is a membrane protein member of the ATP-binding cassette (ABC) transporters superfamily. It
is probably the most promiscuous efflux transporter, since it recognizes a number of structurally
different and apparently unrelated xenobiotics; notably, many of them are also CYP3A4 substrates.
Change explanation: Increase means the
transformation from left to right will increase the risk of inhibition, while Decrease means the transformation from left to right will decrease
the risk of inhibition. No
change means there is no change.
Pgp substrate: As described in the Pgp-inhibitor section, modulation of P-glycoprotein
mediated transport has significant pharmacokinetic implications for Pgp substrates, which may either be
exploited for specific therapeutic advantages or result in contraindications.
Change explanation: Increase means the
transformation from left to right will increase the risk of inhibition, while Decrease means the transformation from left to right will decrease
the risk of inhibition. No
change means there is no change.
F30%: The human oral bioavailability 30%. For any drug administrated by the
oral route, oral bioavailability is undoubtedly one of the most important pharmacokinetic parameters
because it is the indicator of the efficiency of the drug delivery to the systemic circulation.
Change explanation: Increase means the
transformation from left to right will decrease the bioavailability, while Decrease means the transformation from left to right will increase
the bioavailability. No
change means there is no change.
3. Distribution
PPB: Plasma protein binding. One of the major mechanisms of drug uptake and
distribution is through PPB, thus the binding of a drug to proteins in plasma has a strong influence on
its pharmacodynamic behavior. PPB can directly influence the oral bioavailability because the free
concentration of the drug is at stake when a drug binds to serum proteins in this process.
Change explanation: Increase means the
transformation from left to right will increase the value of PPB (△≥+0.3), while Decrease means the transformation from left to right will decrease
the value of PPB (△≤-0.3). No
change means there is almost no change of the value (-0.3<
△<+0.3).
VDss: Volume Distribution. The VD is a theoretical concept that connects the
administered dose with the actual initial concentration present in the circulation and it is an
important parameter to describe the in vivo distribution for drugs. In practical, we can speculate the
distribution characters for an unknown compound according to its VD value, such as its condition binding
to plasma protein, its distribution amount in body fluid and its uptake amount in tissues.
Change explanation: Increase means the
transformation from left to right will increase the value of VDss (△≥+0.3), while Decrease means the transformation from left to right will decrease
the value of VDss (△≤-0.3). No
change means there is almost no change of the value (-0.3<△<+0.3).
BBB penetration: Drugs that act in the CNS need to cross the blood–brain barrier (BBB)
to reach their molecular target. By contrast, for drugs with a peripheral target, little or no BBB
penetration might be required in order to avoid CNS side effects.
Change explanation: Increase means the
transformation from left to right will increase the BBB penetration, while Decrease means the transformation from left to right will decrease
the BBB penetration. No change means there is no change.
4. Metabolism
CYP1A2/ CYP2C19/ CYP2C9/ CYP2D6/ CYP3A4 inhibitor and CYP2D6 substrate: Based on the
chemical nature of biotransformation, the process of drug metabolism reactions can be divided into two
broad categories: phase I (oxidative reactions) and phase II (conjugative reactions). The human
cytochrome P450 family (phase I enzymes) contains 57 isozymes and these isozymes metabolize
approximately two-thirds of known drugs in human with 80% of this attribute to five isozymes––1A2, 2C9,
2C19, 2D6 and 3A4. Most of these CYPs responsible for phase I reactions are concentrated in the liver.
Change explanation: Increase means the
transformation from left to right will increase the risk of inhibition, while Decrease means the transformation from left to right will decrease
the risk of inhibition. No change means there is no change.
5. Excretion
T1/2: The half-life of a drug is a hybrid concept that involves clearance and volume of
distribution, and it is arguably more appropriate to have reliable estimates of these two properties
instead.
Change explanation: Increase means the
transformation from left to right will shorten half-life, while Decrease means the transformation from left to right will
extend half-life. No change means there is no change.
6. Toxicity
H-HT-2: The human hepatotoxicity. Drug induced liver injury is of great concern for
patient safety and a major cause for drug withdrawal from the market. Adverse hepatic effects in
clinical trials often lead to a late and costly termination of drug development programs.
Change explanation: Increase means the
transformation from left to right will increase the risk of toxicity, while Decrease means the transformation from left to right will decrease
the risk of toxicity. No change means there is no change.
hERG Blockers: The human ether-a-go-go related gene. The During cardiac depolarization
and repolarization, a voltagegated potassium channel encoded by hERG plays a major role in the
regulation of the exchange of cardiac action potential and resting potential. The hERG blockade may
cause long QT syndrome (LQTS), arrhythmia, and Torsade de Pointes (TdP), which lead to palpitations,
fainting, or even sudden death.
Change explanation: Increase means the
transformation from left to right will increase the risk of toxicity, while Decrease means the transformation from left to right will decrease
the risk of toxicity. No change means there is no change.
DILI: Drug-induced liver injury (DILI) has become the most common safety problem of
drug withdrawal from the market over the past 50 years.
Change explanation: Increase means the
transformation from left to right will increase the risk of toxicity, while Decrease means the transformation from left to right will decrease
the risk of toxicity. No change means there is no change.
AMES Toxicity: The Ames test for mutagenicity. The mutagenic effect has a close
relationship with the carcinogenicity, and it is the most widely used assay for testing the mutagenicity
of compounds.
Change explanation: Increase means the
transformation from left to right will increase the risk of toxicity, while Decrease means the transformation from left to right will decrease
the risk of toxicity. No change means there is no change.
FDAMDD: The maximum recommended daily dose provides an estimate of the toxic dose
threshold of chemicals in humans.
Change explanation: Increase means the
transformation from left to right will increase the risk of toxicity, while Decrease means the transformation from left to right will decrease
the risk of toxicity. No change means there is no change.
Skin Sensitization: Skin sensitization is a potential adverse effect for dermally
applied products. The evaluation of whether a compound, that may encounter the skin, can induce allergic
contact dermatitis is an important safety concern.
Change explanation: Increase means the
transformation from left to right will increase the risk of toxicity, while Decrease means the transformation from left to right will decrease
the risk of toxicity. No change means there is no change.
Eye Corrosion/Irritation: Assessing the eye irritation/corrosion (EI/EC) potential of a
chemical is a necessary component of risk assessment. Cornea and conjunctiva tissues comprise the
anterior surface of the eye, and hence cornea and conjunctiva tissues are directly exposed to the air
and easily suffer injury by chemicals. There are several substances, such as chemicals used in
manufacturing, agriculture and warfare, ocular pharmaceuticals, cosmetic products, and household
products which can cause EI or EC.
Change explanation: Increase means the
transformation from left to right will increase the risk of toxicity, while Decrease means the transformation from left to right will decrease
the risk of toxicity. No change means there is no change.
Respiratory Toxicity: Among these safety issues, respiratory toxicity has become the
main cause of drug withdrawal. Drug induced respiratory toxicity is usually underdiagnosed because it
may not have distinct early signs or symptoms in common medications and can occur with significant
morbidity and mortality. Therefore, careful surveillance and treatment of respiratory toxicity is of
great importance.
Change explanation: Increase means the
transformation from left to right will increase the risk of toxicity, while Decrease means the transformation from left to right will decrease
the risk of toxicity. No change means there is no change.
IGC50: 48 hour Tetrahymena pyriformis IGC50 (concentration of the test chemical in
water in mg/L that causes 50% growth inhibition to Tetrahymena pyriformis after 48 hours). The unit of
IGC50 is −log10[(mg/L)/(1000*MW)].
Change explanation: Increase means the
transformation from left to right will increase the risk of toxicity, while Decrease means the transformation from left to right will decrease
the risk of toxicity. No change means there is no change.
NR-AR: Androgen receptor (AR), a nuclear hormone receptor, plays a critical role in
AR-dependent prostate cancer and other androgen related diseases. Endocrine disrupting chemicals (EDCs)
and their interactions with steroid hormone receptors like AR may cause disruption of normal endocrine
function as well as interfere with metabolic homeostasis, reproduction, developmental and behavioral
functions.
Change explanation: Increase means the
transformation from left to right will increase the risk of toxicity, while Decrease means the transformation from left to right will decrease
the risk of toxicity. No change means there is no change.
NR-AR-LBD: Androgen receptor (AR), a nuclear hormone receptor, plays a critical role in
AR-dependent prostate cancer and other androgen related diseases. Endocrine disrupting chemicals (EDCs)
and their interactions with steroid hormone receptors like AR may cause disruption of normal endocrine
function as well as interfere with metabolic homeostasis, reproduction, developmental and behavioral
functions.
Change explanation: Increase means the
transformation from left to right will increase the risk of toxicity, while Decrease means the transformation from left to right will decrease
the risk of toxicity. No change means there is no change.
NR-AhR: The Aryl hydrocarbon Receptor (AhR), a member of the family of basic
helix-loop-helix transcription factors, is crucial to adaptive responses to environmental changes. AhR
mediates cellular responses to environmental pollutants such as aromatic hydrocarbons through induction
of phase I and II enzymes but also interacts with other nuclear receptor signaling pathways.
Change explanation: Increase means the
transformation from left to right will increase the risk of toxicity, while Decrease means the transformation from left to right will decrease
the risk of toxicity. No change means there is no change.
SR-ARE: Oxidative stress has been implicated in the pathogenesis of a variety of
diseases ranging from cancer to neurodegeneration. The antioxidant response element (ARE) signaling
pathway plays an important role in the amelioration of oxidative stress. The CellSensor ARE-bla HepG2
cell line (Invitrogen) can be used for analyzing the Nrf2/antioxidant response signaling pathway. Nrf2
(NF-E2-related factor 2) and Nrf1 are transcription factors that bind to AREs and activate these genes.
Change explanation: Increase means the
transformation from left to right will increase the risk of toxicity, while Decrease means the transformation from left to right will decrease
the risk of toxicity. No change means there is no change.
SR-MMP: Mitochondrial membrane potential (MMP), one of the parameters for mitochondrial
function, is generated by mitochondrial electron transport chain that creates an electrochemical
gradient by a series of redox reactions. This gradient drives the synthesis of ATP, a crucial molecule
for various cellular processes. Measuring MMP in living cells is commonly used to assess the effect of
chemicals on mitochondrial function; decreases in MMP can be detected using lipophilic cationic
fluorescent dyes.
Change explanation: Increase means the
transformation from left to right will increase the risk of toxicity, while Decrease means the transformation from left to right will decrease
the risk of toxicity. No change means there is no change.
Explanation-Transform
MMP: Matched molecular pairs. MMP is generally defined as a pair of compounds that can be interconverted by a well-defined chemical transformation at a single site, with the change between the pair elements referring to the transform, and the invariant feature referring to the context.
Transformation Rule: this term refers to the chemical transformation leading to a change in a pharmacological or physiochemical endpoint. For global rules, they need to attain enough MMPs (≥5 for labeled-data, ≥10 for consecutive data).
Global rules: Transformation rules which are summarized without considering the context information.
Local transformation: Transformations which are summarized based on the consideration of substructure change and localized atom information. There are a total of 10 types of localized atom, including aromatic/aliphatic carbon, aromatic/aliphatic nitrogen, aromatic/aliphatic oxygen, aromatic/aliphatic sulfur, halogen atoms and other.
Average change: The average property change value of the specific transformation.
Variance: The index of overall property change of a specific transformation. According to the direction and range of average change, three variance levels are provided: Increase (△>0 for labeled-data, △≥+0.3 for consecutive data), No change (△=0 for labeled-data, -0.3≤△≤+0.3 for consecutive data) and Decrease (△<0 for labeled-data, △≤-0.3 for consecutive data).
Distribution: The distribution of MMP value changes of a specific transformation. Three variance levels are provided: Increase (△≥0 for labeled-data, △≥+0.3 for consecutive data), No change (△=0 for labeled-data, +0.3≥△≥-0.3 for consecutive data) and Decrease (△<0 for labeled-data, -0.3≥△ for consecutive data).
Credibility: The index of the credibility of transformation rule. Two credibility levels are provided: High (passed the statistical significance test) and Qualified (didn’t pass the statistical significance test).
Experimental database: Transformation rules are summarized from the 178,197 experimental data which were collected from literature and databases.
Expanded database: Transformation rules are summarized from the combination of 178,197 experimental and 244,845 accurate predicted data, which are used as the supplementary guidance.
References
- [1] Lumley, J. A. , Desai, P. , Wang, J. , Cahya, S. , & Zhang, H. The Derivation of a Matched Molecular Pairs Based ADME/Tox Knowledge Base for Compound Optimization. Journal of Chemical Information and Modeling, 2020, 60(10): 4757-4771.
- [2] Griffen, E. , Leach, A. G. , Robb, G. R. , & Warner, D. J. Matched molecular pairs as a medicinal chemistry tool. J Med Chem, 2011, 54(22): 7739-7750.
- [3] Kramer, C. , Ting, A. , Zheng, H. , Hert, J. , Schindler, T. , Stahl, M. , Robb, G. , Crawford, J. J. , Blaney, J. , Montague, S. , Leach, A. G. , Dossetter, A. G. , & Griffen, E. J. Learning Medicinal Chemistry Absorption, Distribution, Metabolism, Excretion, and Toxicity (ADMET) Rules from Cross-Company Matched Molecular Pairs Analysis (MMPA). J Med Chem, 2018, 61(8): 3277-3292.
- [4] Sushko, Y. , Novotarskyi, S. , Korner, R. , Vogt, J. , Abdelaziz, A. , & Tetko, I. V. Prediction-driven matched molecular pairs to interpret QSARs and aid the molecular optimization process. J Cheminform, 2014, 6(1): 48.
- [5] Dong, J. , Wang, N. N. , Yao, Z. J. , Zhang, L. , Cheng, Y. , Ouyang, D. , Lu, A. P. , & Cao, D. S. ADMETlab: a platform for systematic ADMET evaluation based on a comprehensively collected ADMET database. J Cheminform, 2018, 10(1): 29.
- [6] Xiong, G. , Wu, Z. , Yi, J. , Fu, L. , Yang, Z. , Hsieh, C. , Yin, M. , Zeng, X. , Wu, C. , Lu, A. , Chen, X. , Hou, T. , & Cao, D. ADMETlab 2.0: an integrated online platform for accurate and comprehensive predictions of ADMET properties. Nucleic Acids Res, 2021, doi: 10.1093/nar/gkab255.
- [7] Fu, L. , Liu, L. , Yang, Z. J. , Li, P. , Ding, J. J. , Yun, Y. H. , Lu, A. P. , Hou, T. J. , & Cao, D. S. Systematic Modeling of logD7.4 Based on Ensemble Machine Learning, Group Contribution, and Matched Molecular Pair Analysis. J Chem Inf Model, 2020, 60(1): 63-76.
- [8] Fu, L. , Yang, Z. Y. , Yang, Z. J. , Yin, M. Z. , Lu, A. P. , Chen, X. , Liu, S. , Hou, T. J. , & Cao, D. S. QSAR-assisted-MMPA to expand chemical transformation space for lead optimization. Brief Bioinform, 2021, doi: 10.1093/bib/bbaa374.